Benchmark
The Benchmark page runs the generic RCA benchmark engine (the same annotation and root-cause agents the app uses in production) against a dataset you provide. It ships as a check for your own setup and a way to reproduce research-style evaluation on your own data, not with the paper's private corpus attached.
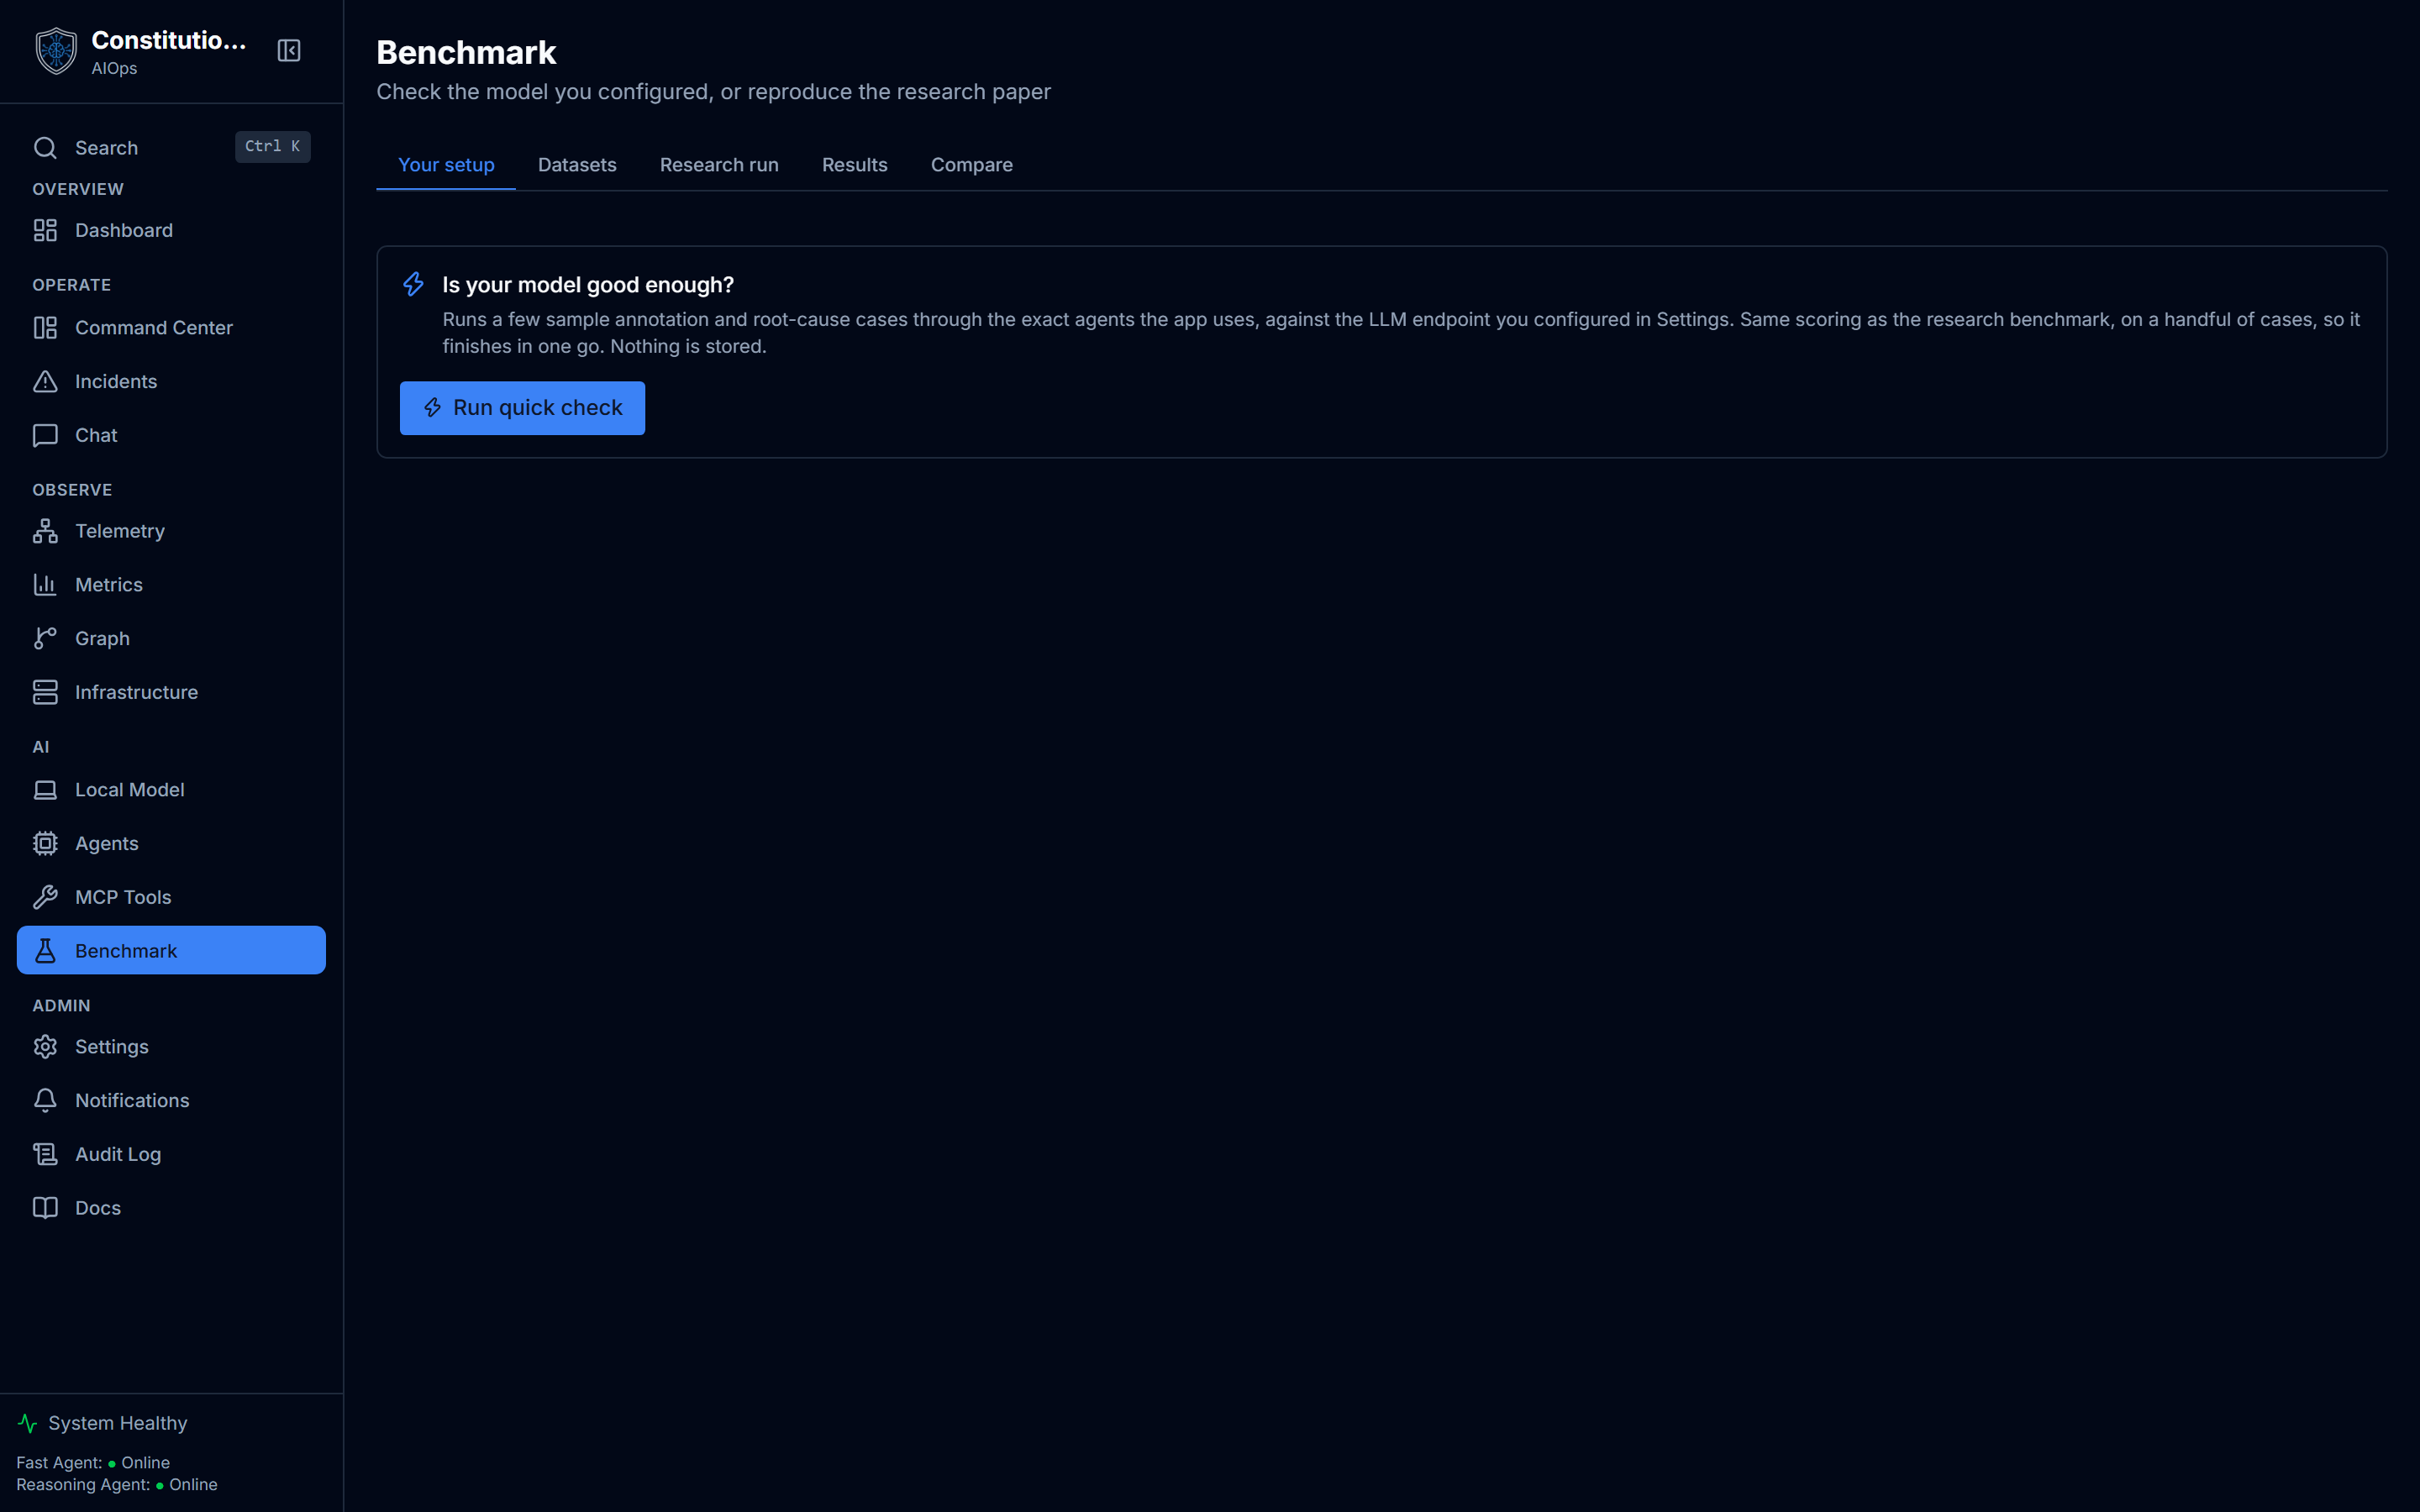
What you see
Five tabs:
- Your setup. A one-click quick check: run a handful of sample annotation and RCA cases through the exact agents the app uses, against the LLM endpoint you configured in Settings. Returns a pass rate, average latency, a pass/run breakdown by task type, and a per-case table (case ID, task type, source, latency, pass/fail). Nothing from this run is stored.
- Datasets. Cards for each dataset found under
data/benchmark, showing name, file, total case count, source, description, and a distribution or category breakdown where the dataset provides one. - Research run. Pick a model, set a maximum number of annotation tests and RCA tests, and start a full run in the background. A progress bar tracks task type and percent complete while it runs.
- Results. A table of completed runs (model, annotation accuracy, RCA accuracy, BERTScore F1, average latency, p95 latency, status), with export buttons for JSON, CSV, and LaTeX.
- Compare. Side-by-side bars for annotation accuracy and RCA accuracy across every model you've run, once you have results for two or more.
How to use it
- Start with Your setup if you just want to know whether the model you pointed the app at is good enough. It runs against the same scoring as a full research run, just on a handful of cases so it finishes in one request.
- Open Datasets to see what's actually loaded: case count, source, and description for each file under
data/benchmark. - To reproduce a fuller evaluation, go to Research run, choose a model and test limits, and start it. Watch progress there; it keeps running in the background even if you switch tabs.
- Check Results once a run completes, and export it as JSON, CSV, or a LaTeX table if you need the numbers elsewhere.
- Use Compare once you have two or more completed runs to see them side by side.
Bring your own dataset
The public repository ships the generic benchmark engine (the runner and the scoring logic) and a small synthetic sample dataset, not the paper's private research corpus. The sample exists so the Datasets, Results, and Compare tabs have something to render out of the box; it is invented data, not real telemetry.
To evaluate against your own cases, replace the JSON files under data/benchmark/intermediate/datasets/ with your own, in the same shape (each case carries an id, an input or incident block, and an expected answer). Regenerate or inspect the synthetic sample as a template with:
python scripts/seed_benchmark_data.pyThen start a run from the Research run tab as usual. A configured LLM endpoint is required either way.
No paper numbers ship with the app
The datasets and results you see out of the box are synthetic samples, not the paper's benchmark. Any accuracy figures you see on this page are numbers your own configured endpoint produced against whatever dataset is currently loaded, never a reproduction of a published result.
Scoring
Each case is scored by comparing the agent's structured output against the expected fields, not by a raw string match. Annotation cases check anomaly detection, severity, and category, with partial credit for close severities. RCA cases check whether the identified root cause matches one of the acceptable answers, plus partial credit for a valid causal chain, impact assessment, and remediation steps. BERTScore adds a semantic-similarity score on top of that rule-based check.
Export formats
The Results tab exports in three formats: JSON (the full result records), CSV (model, annotation accuracy, RCA accuracy, BERTScore F1, average and p95 latency), and LaTeX (a formatted comparison table you can drop straight into a paper).
Admin-only actions
Starting a research run or running the quick check both spend the box's configured LLM endpoint, so both are admin actions and the backend enforces a 403 for non-admins. Everyone can still view datasets, results, and comparisons.
Reading results

The Results tab is one row per completed run. Each row carries the model name, annotation accuracy, RCA accuracy, BERTScore F1, average latency in milliseconds, and a pass or fail status icon. The three buttons above the table export the whole set as JSON, CSV, or a LaTeX table.
The numbers above are the demo's synthetic sample, so they read close to the paper's ranges without being the paper. Your own runs replace them once you start one from the Research run tab against your configured endpoint.
Comparing models
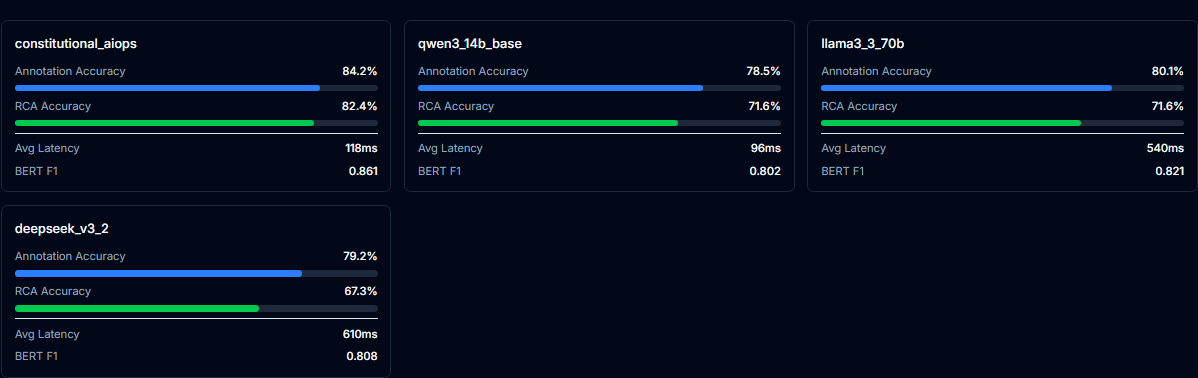
Once two or more runs finish, the Compare tab lays them side by side. Each model gets a card with an annotation-accuracy bar, an RCA-accuracy bar, its average latency, and its BERTScore F1. It reads the same numbers as the Results table and draws them as bars, so a stronger model stands out at a glance. With fewer than two results the tab just asks you to run more.
Related
- Metrics covers raw latency benchmarking and determinism checks, separate from RCA accuracy scoring.
- Guide: Benchmarking walks through the same two tabs in more depth, including the dataset schema.
- Settings is where you configure the LLM endpoint this page evaluates against.