Telemetry
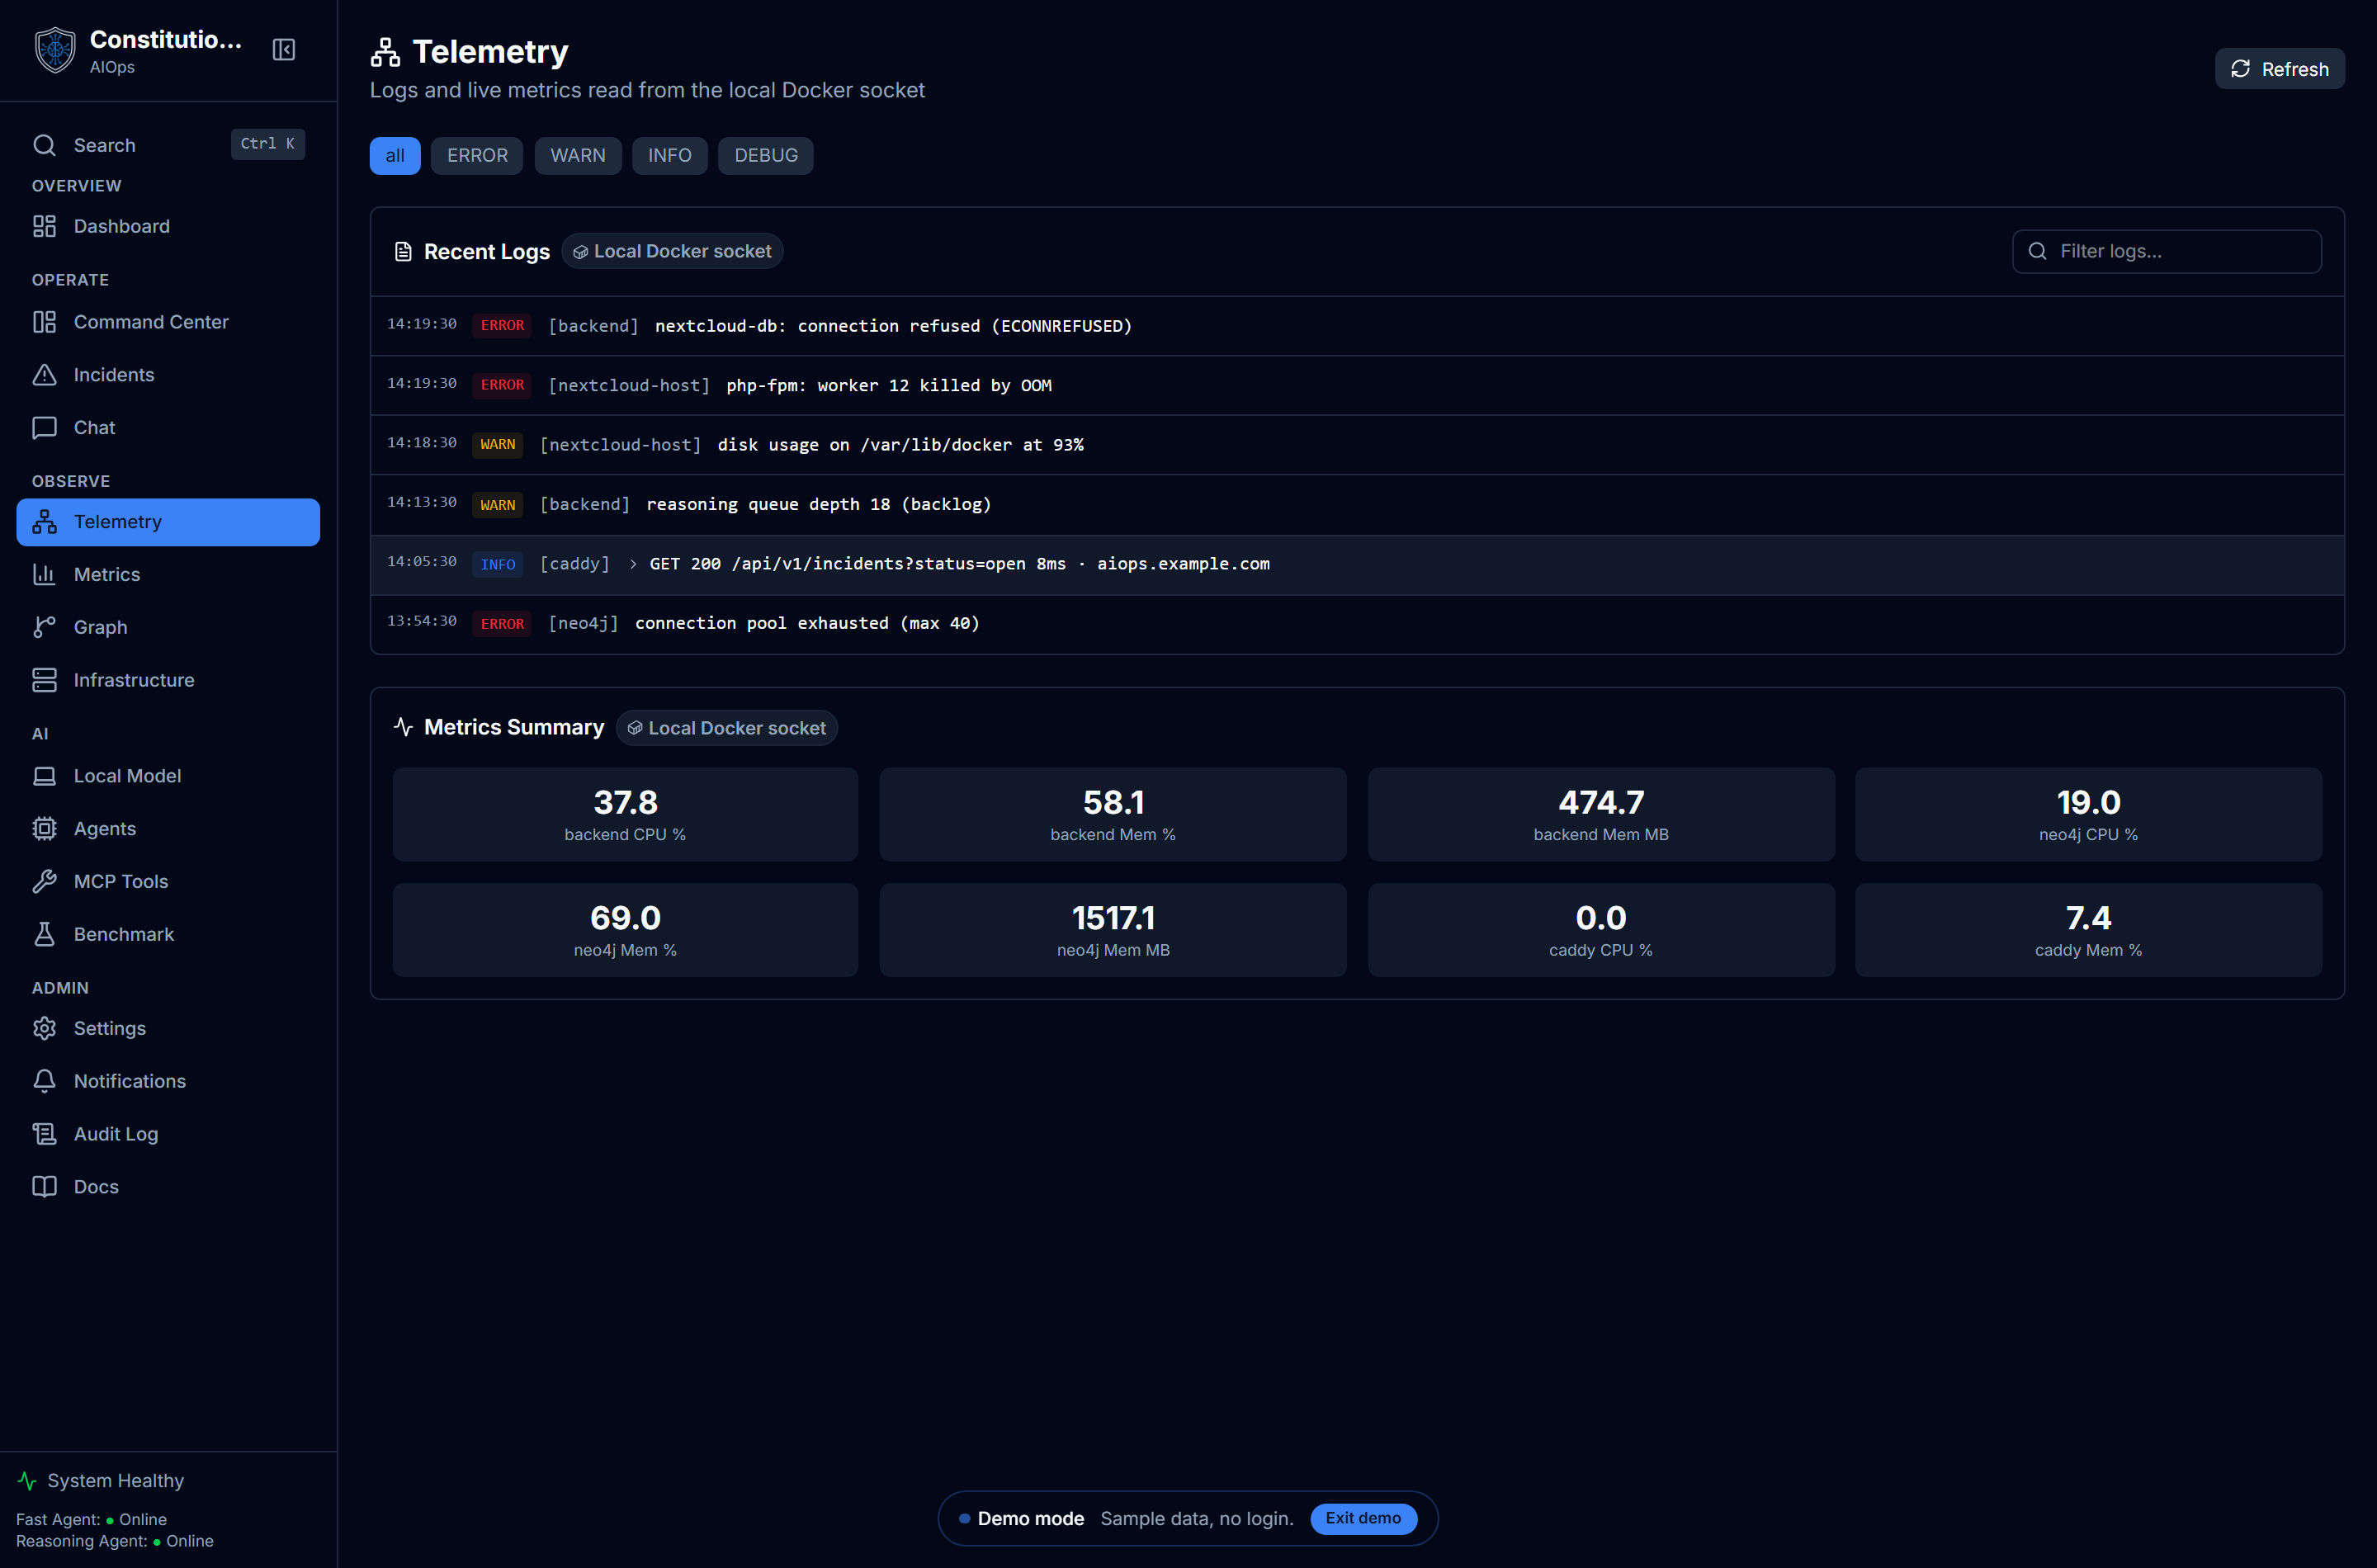
The Telemetry page shows raw logs and metrics, each one labeled with where it actually came from. It never blends a real observability stack with a fallback source without saying so.
What you see
- A source-aware subtitle. It reads "Logs and live metrics read from the local Docker socket," "Logs, metrics, and traces from the LGTM stack," or "Connect a monitoring source to see logs and metrics," depending on what actually answered the last fetch.
- Recent Logs, from
GET /api/v1/telemetry/logs, with a level filter (all, ERROR, WARN, INFO, DEBUG) and a free-text filter over message and service. Container log lines (Caddy access logs and structured backend logs in particular) are cleaned up: ANSI codes stripped, a one-line summary shown, and the full JSON payload available by clicking to expand it. - A source badge next to Recent Logs and next to Metrics Summary, naming where that panel's data came from: "Local Docker socket," "LGTM stack," or no badge at all when there is no source.
- Metrics Summary, from
GET /api/v1/telemetry/metrics, a grid of up to eight metric values with their labels.
How to use it
- Read the subtitle first. It tells you, honestly, whether you are looking at a full LGTM stack or the local Docker fallback.
- Filter logs by level to cut down noise, or type in the search box to filter by message text or service name.
- Click a structured log line to expand its full JSON. Caddy access logs summarize to method, status, URI, duration, and host; other structured lines show their message field first.
- Check the source badges on both panels. If they disagree (one shows LGTM, the other Docker), that tells you one telemetry backend is up and the other isn't.
- Use Refresh to pull a new snapshot on demand.
Reading a structured log line
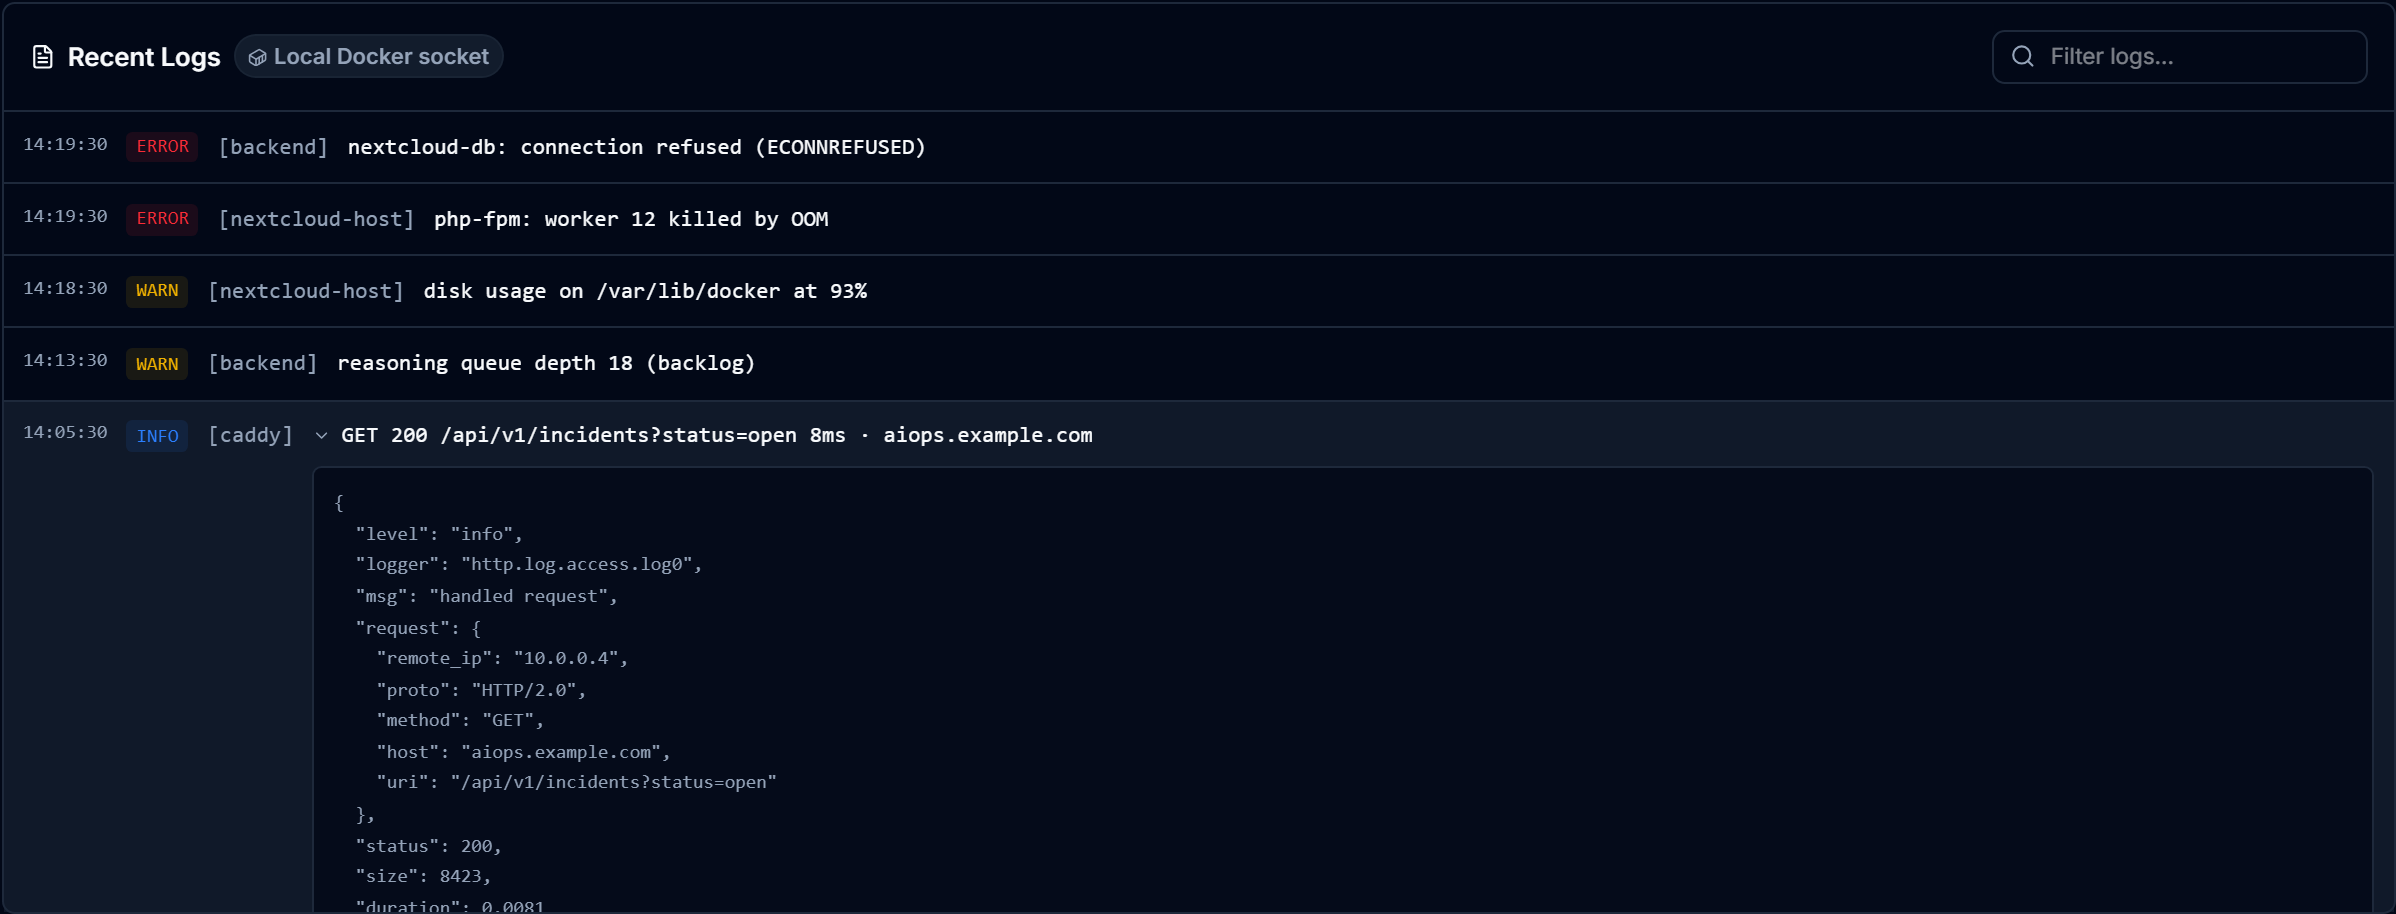
Container stdout is not always a clean sentence. A Caddy access log arrives as a JSON object wrapped in ANSI colour codes, unreadable when dumped raw. The page strips the colour codes and shows a one-line summary instead: method, status, path, duration, and host. Click the line to expand the full JSON payload beneath it, with the request block, status, size, and duration intact. The level badges colour by severity and the source badge names where the line came from, so you always know you are reading real container output rather than a fabricated feed.
Data provenance
Every log and metric fetch tries the LGTM stack first: Loki for logs, Prometheus for metrics. If that returns nothing and the local Docker socket source is enabled (Settings → Telemetry), the backend falls back to reading directly from the Docker socket: container logs and live CPU/memory stats. The fallback only ever runs when Loki or Prometheus produced zero results, so a working LGTM stack is never shadowed by the fallback.
Lite-profile degradation
On the lite / self-host profile there is often no LGTM stack at all. In that case Recent Logs and Metrics Summary show an explicit empty state ("No logs available" / "No metrics available") with a link to Settings → Telemetry to add a Loki or Prometheus endpoint, or enable the Docker socket source. Nothing is invented to fill the gap.
Related
- Dashboard surfaces the same latency and health signals in summary form on the main landing page.
- Settings is where you configure the Loki, Prometheus, and Tempo endpoints, and toggle the local Docker socket source.
- Console pairs live topology with the assistant if you want to investigate rather than just read a feed.