Infrastructure
The Infrastructure page shows the Docker containers this stack can see, lets you pick which ones to monitor, and walks you through wiring up a remote Linux host so its containers show up here too.
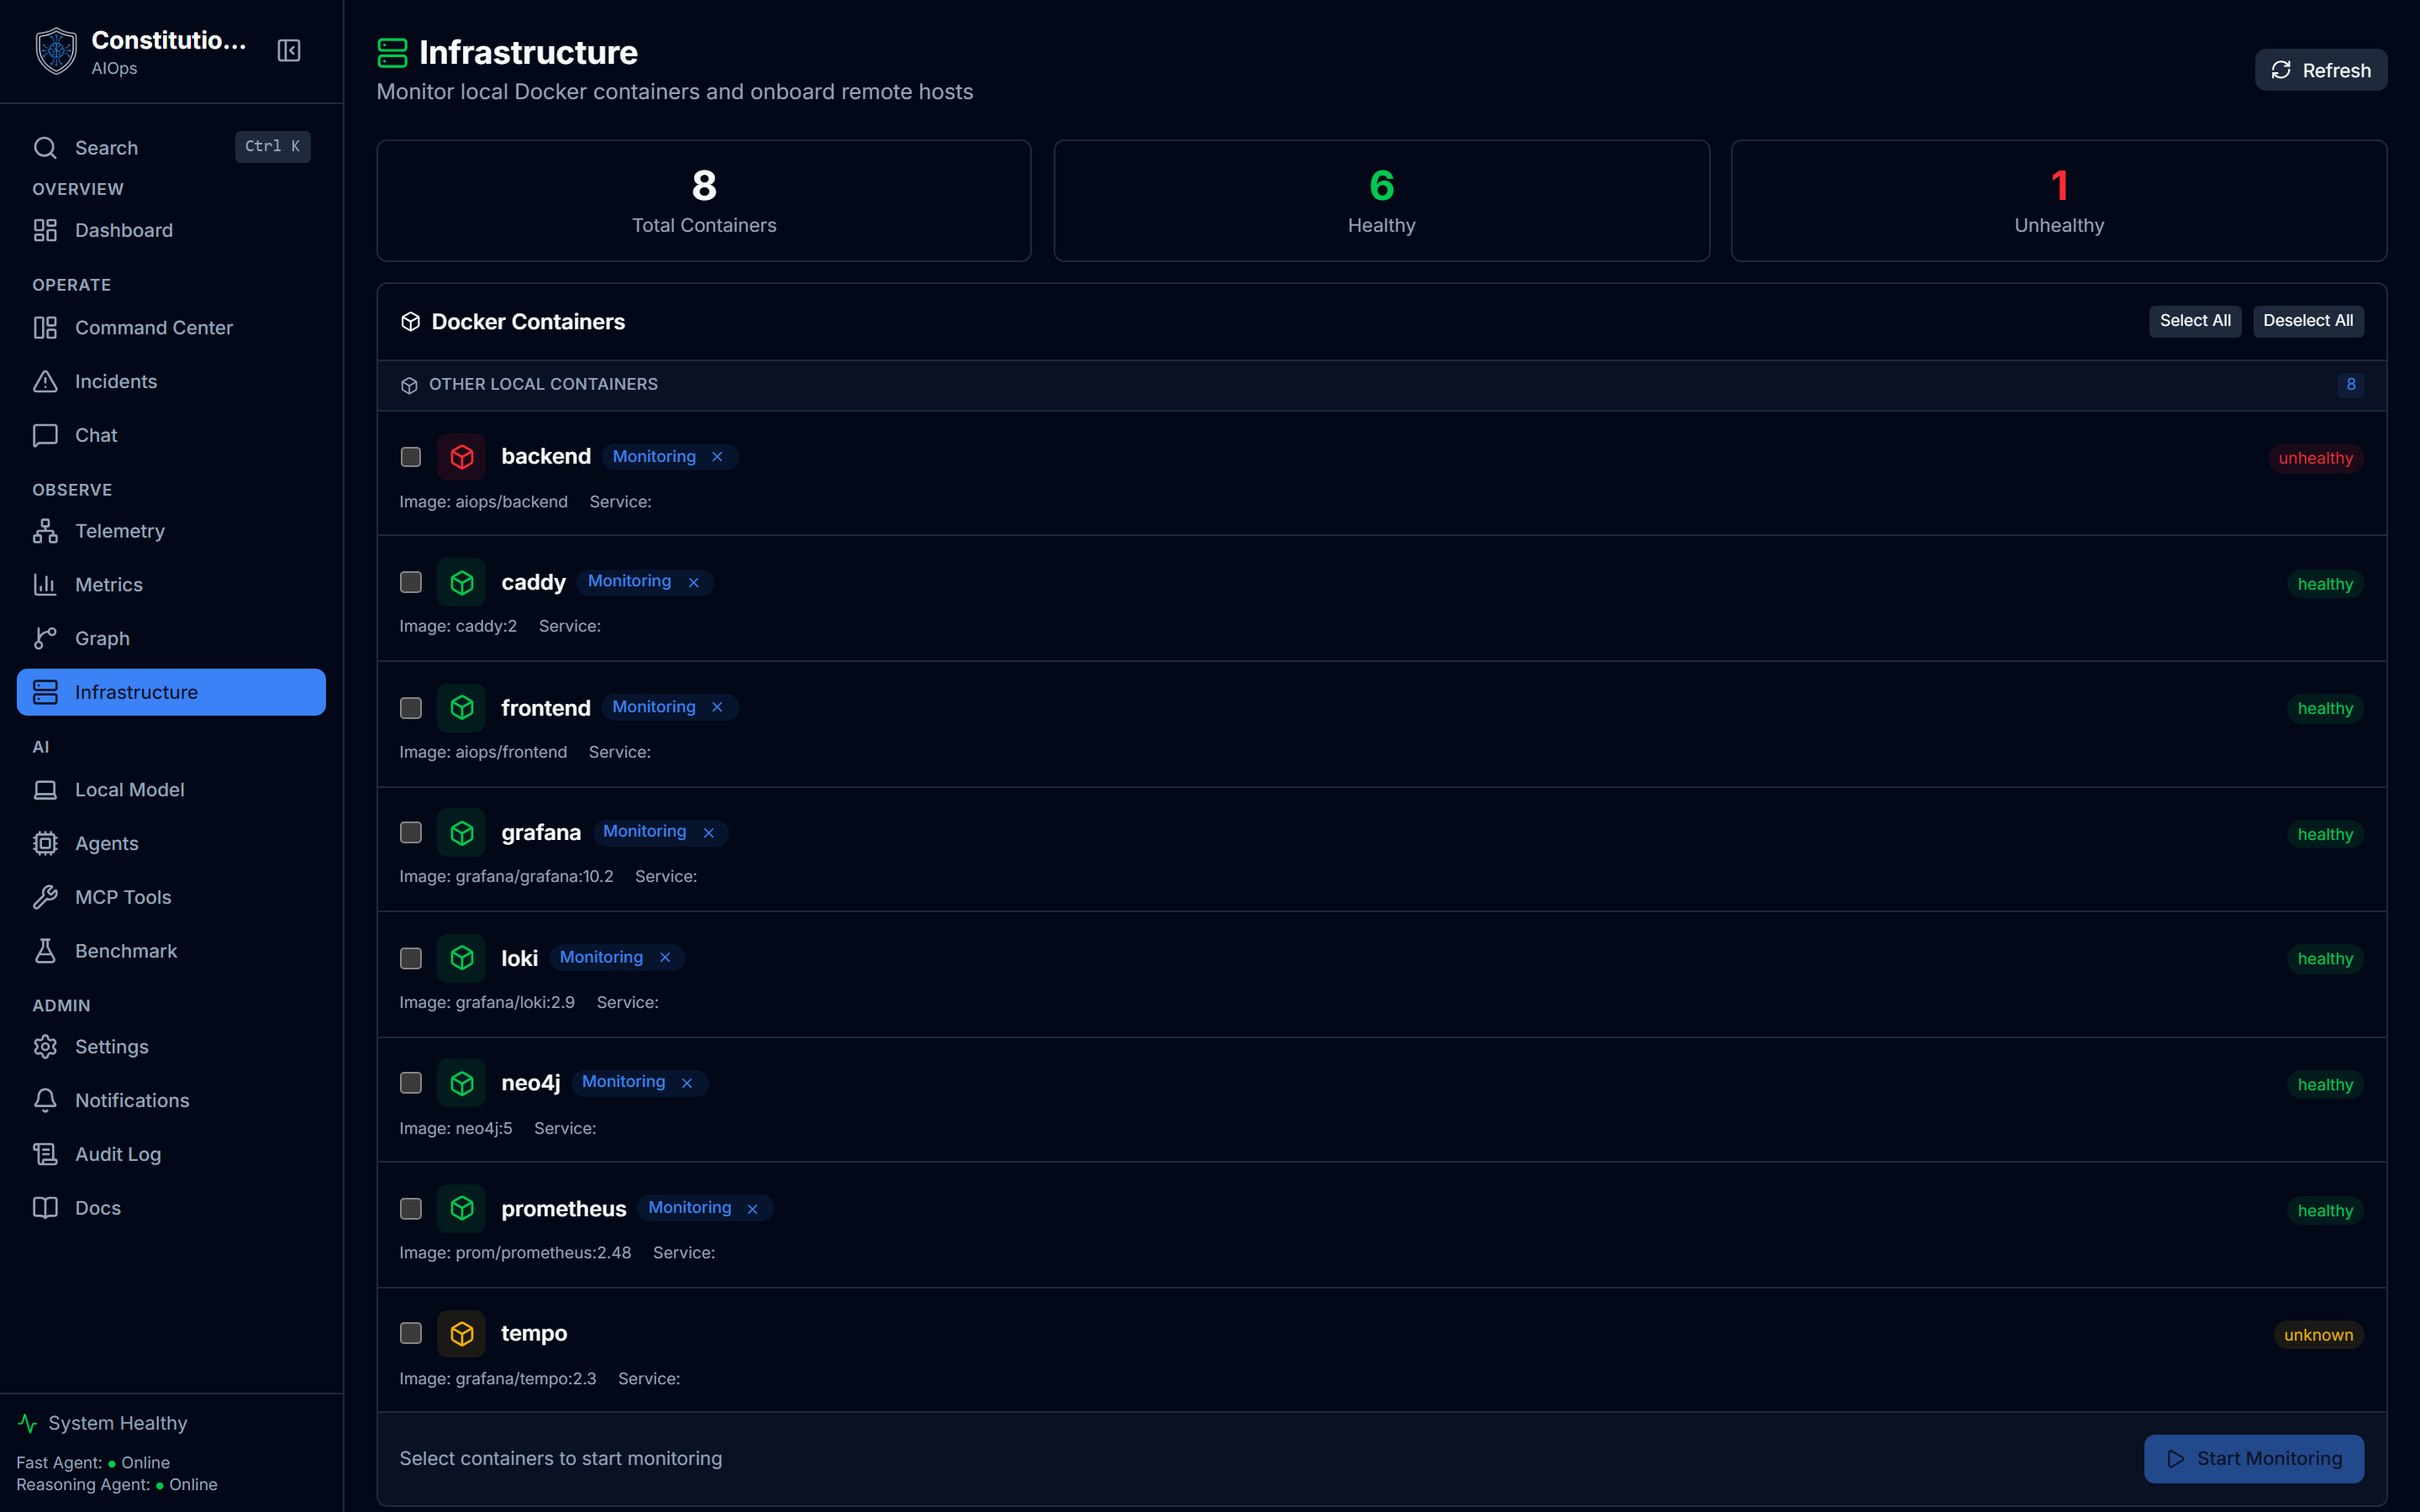
What you see
- Container stats: total, healthy, and unhealthy counts across whatever is currently monitored.
- Docker Containers list, split into two groups: platform containers (the
aiops-*stack itself: frontend, backend, Neo4j, Loki, Prometheus, Tempo, Grafana, the OTel collector) and other local containers (anything else on the host, includingnextcloudif it is running). Each row shows health, status, port, and image, and you can select rows with a checkbox. - Monitored remote hosts, a list of any Linux host running a Grafana Alloy edge agent that ships telemetry here. Each entry shows up/down/unknown status, how many Prometheus scrape targets are up, recent log line count over the last 15 minutes, and when it was last seen.
- Monitor a Remote Host, a guided onboarding block: ingest endpoint URLs (Loki push, Prometheus remote-write, OTLP), an agent configuration form (edge label, ingest user, ingest password), a generated
.envblock you can copy, a Docker Compose quickstart for the remote host, and a verify step that checks whether telemetry tagged with your edge label has arrived. - Demo / Chaos panel, only shown when the backend's demo agent is reachable and enabled: fault-injection scenarios you can start and heal against a demo target, plus a field to set that target's URL.
How to use it
- Select containers in the Docker Containers list, then click Start Monitoring. This adds them to the backend's monitored set and (if the Fast Agent is available) processes their recent log lines through it.
- Stop monitoring a container from its row's
Xbutton next to the "Monitoring" badge. - Refresh to re-pull both the container list and remote hosts from the backend.
- Onboard a remote host: set a domain if the default (your current origin) is wrong, fill in an edge label and ingest credentials, copy the generated
.env, and run the quickstart commands on the remote Linux host. - Verify telemetry arrived with the Check Now button, which queries
/api/v1/telemetry/logsfiltered by your edge label. You can also open Grafana directly and run the LogQL/PromQL checks shown. - Dismiss a remote host you no longer want listed with its trash-can button. This does not delete telemetry: it only hides the label until you restore it, and it reappears if the host keeps shipping data.
Onboarding a remote host
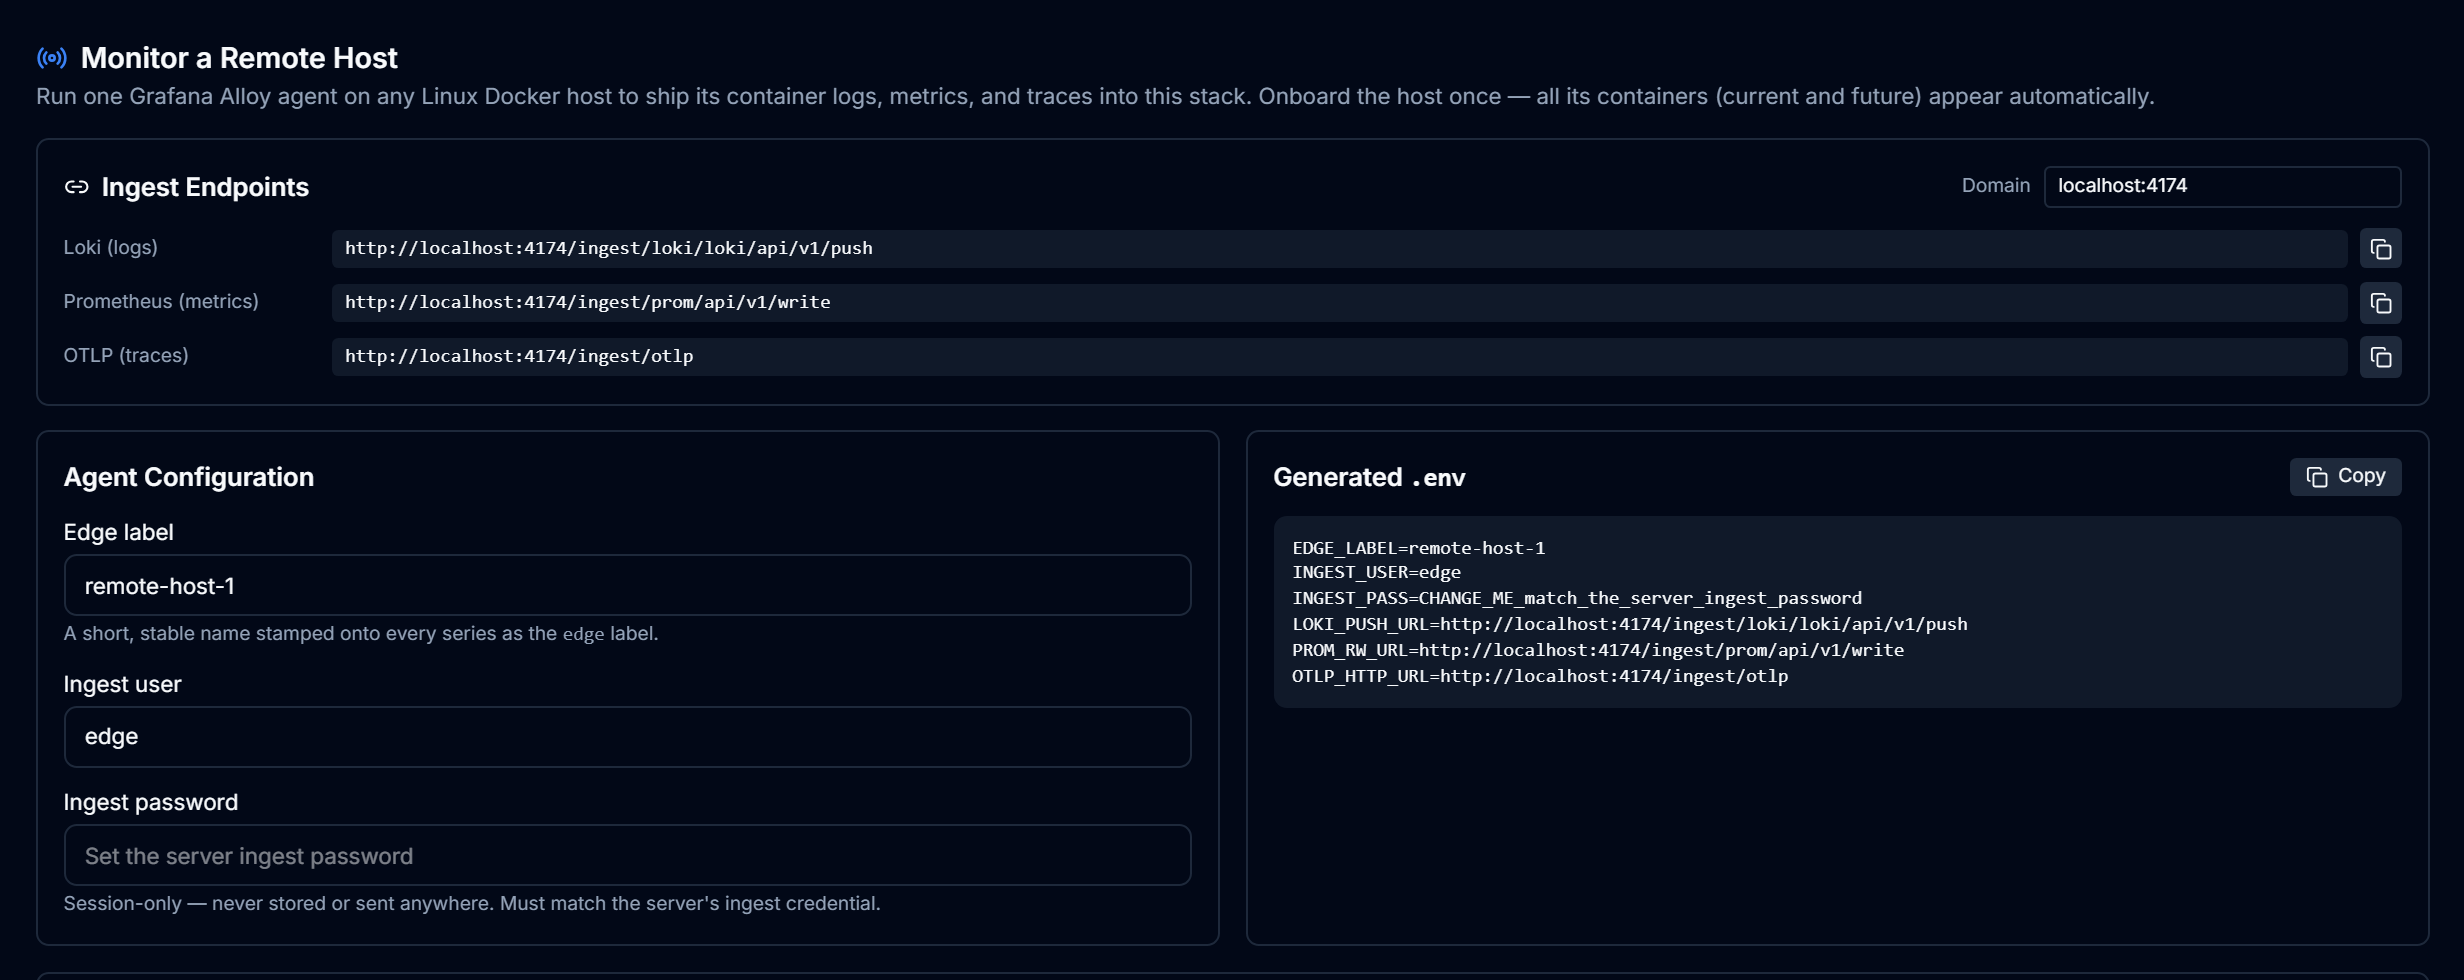
The onboarding block does the wiring for you. The ingest endpoint URLs are built from your own domain, so Loki, Prometheus, and OTLP each get a copy button. Fill in an edge label and the ingest credentials and the generated .env block updates live, ready to paste onto the remote host beside one Grafana Alloy agent. The ingest password stays in the browser for the session only and is never saved, so nothing sensitive is written to disk on this side.
The remote-host list is derived, not managed
Monitored remote hosts are not something you register by hand. The backend queries Prometheus for count by (edge) (up) and Loki for recent log volume per edge label, and any label it finds becomes a row. Dismissing a host adds its label to a persisted denylist rather than touching telemetry, so a host that keeps sending data resurfaces once you restore it.
Local vs remote containers
The Docker Containers list only shows what the backend's own Docker socket can see: this stack's platform containers, plus anything else running on the same host. It cannot see containers on a different machine. That is what the remote-host onboarding flow is for: it is Linux-only (the agent bind-mounts the Docker socket), so a Windows laptop cannot host it.
Docker socket required
If the backend has no access to a Docker socket, the containers list comes back empty rather than showing a fabricated roster of services that may not even be deployed.
Demo / Chaos
This panel injects and heals faults against a separate demo target (a nextcloud / nextcloud-db pair by default) so you can watch the AI diagnose and remediate something concrete. It needs a reachable demo agent and is disabled outright on lite and bring-your-own-endpoint deployments, where the backend returns 403 and the panel does not render at all.
Related
- MCP tools lists
list_containers,restart_service, andscale_serviceas callable tools with the same constitutional gate. - Metrics and Telemetry show what a monitored container or remote host actually reports.
- Guide: Self-hosting covers running this stack yourself, including the Docker socket mount this page depends on.