Metrics
The Metrics page shows measured LLM performance: real request counts and latency percentiles for the fast and reasoning agents, not model estimates. It also runs on-demand benchmarks and determinism checks against whatever endpoint you configured.
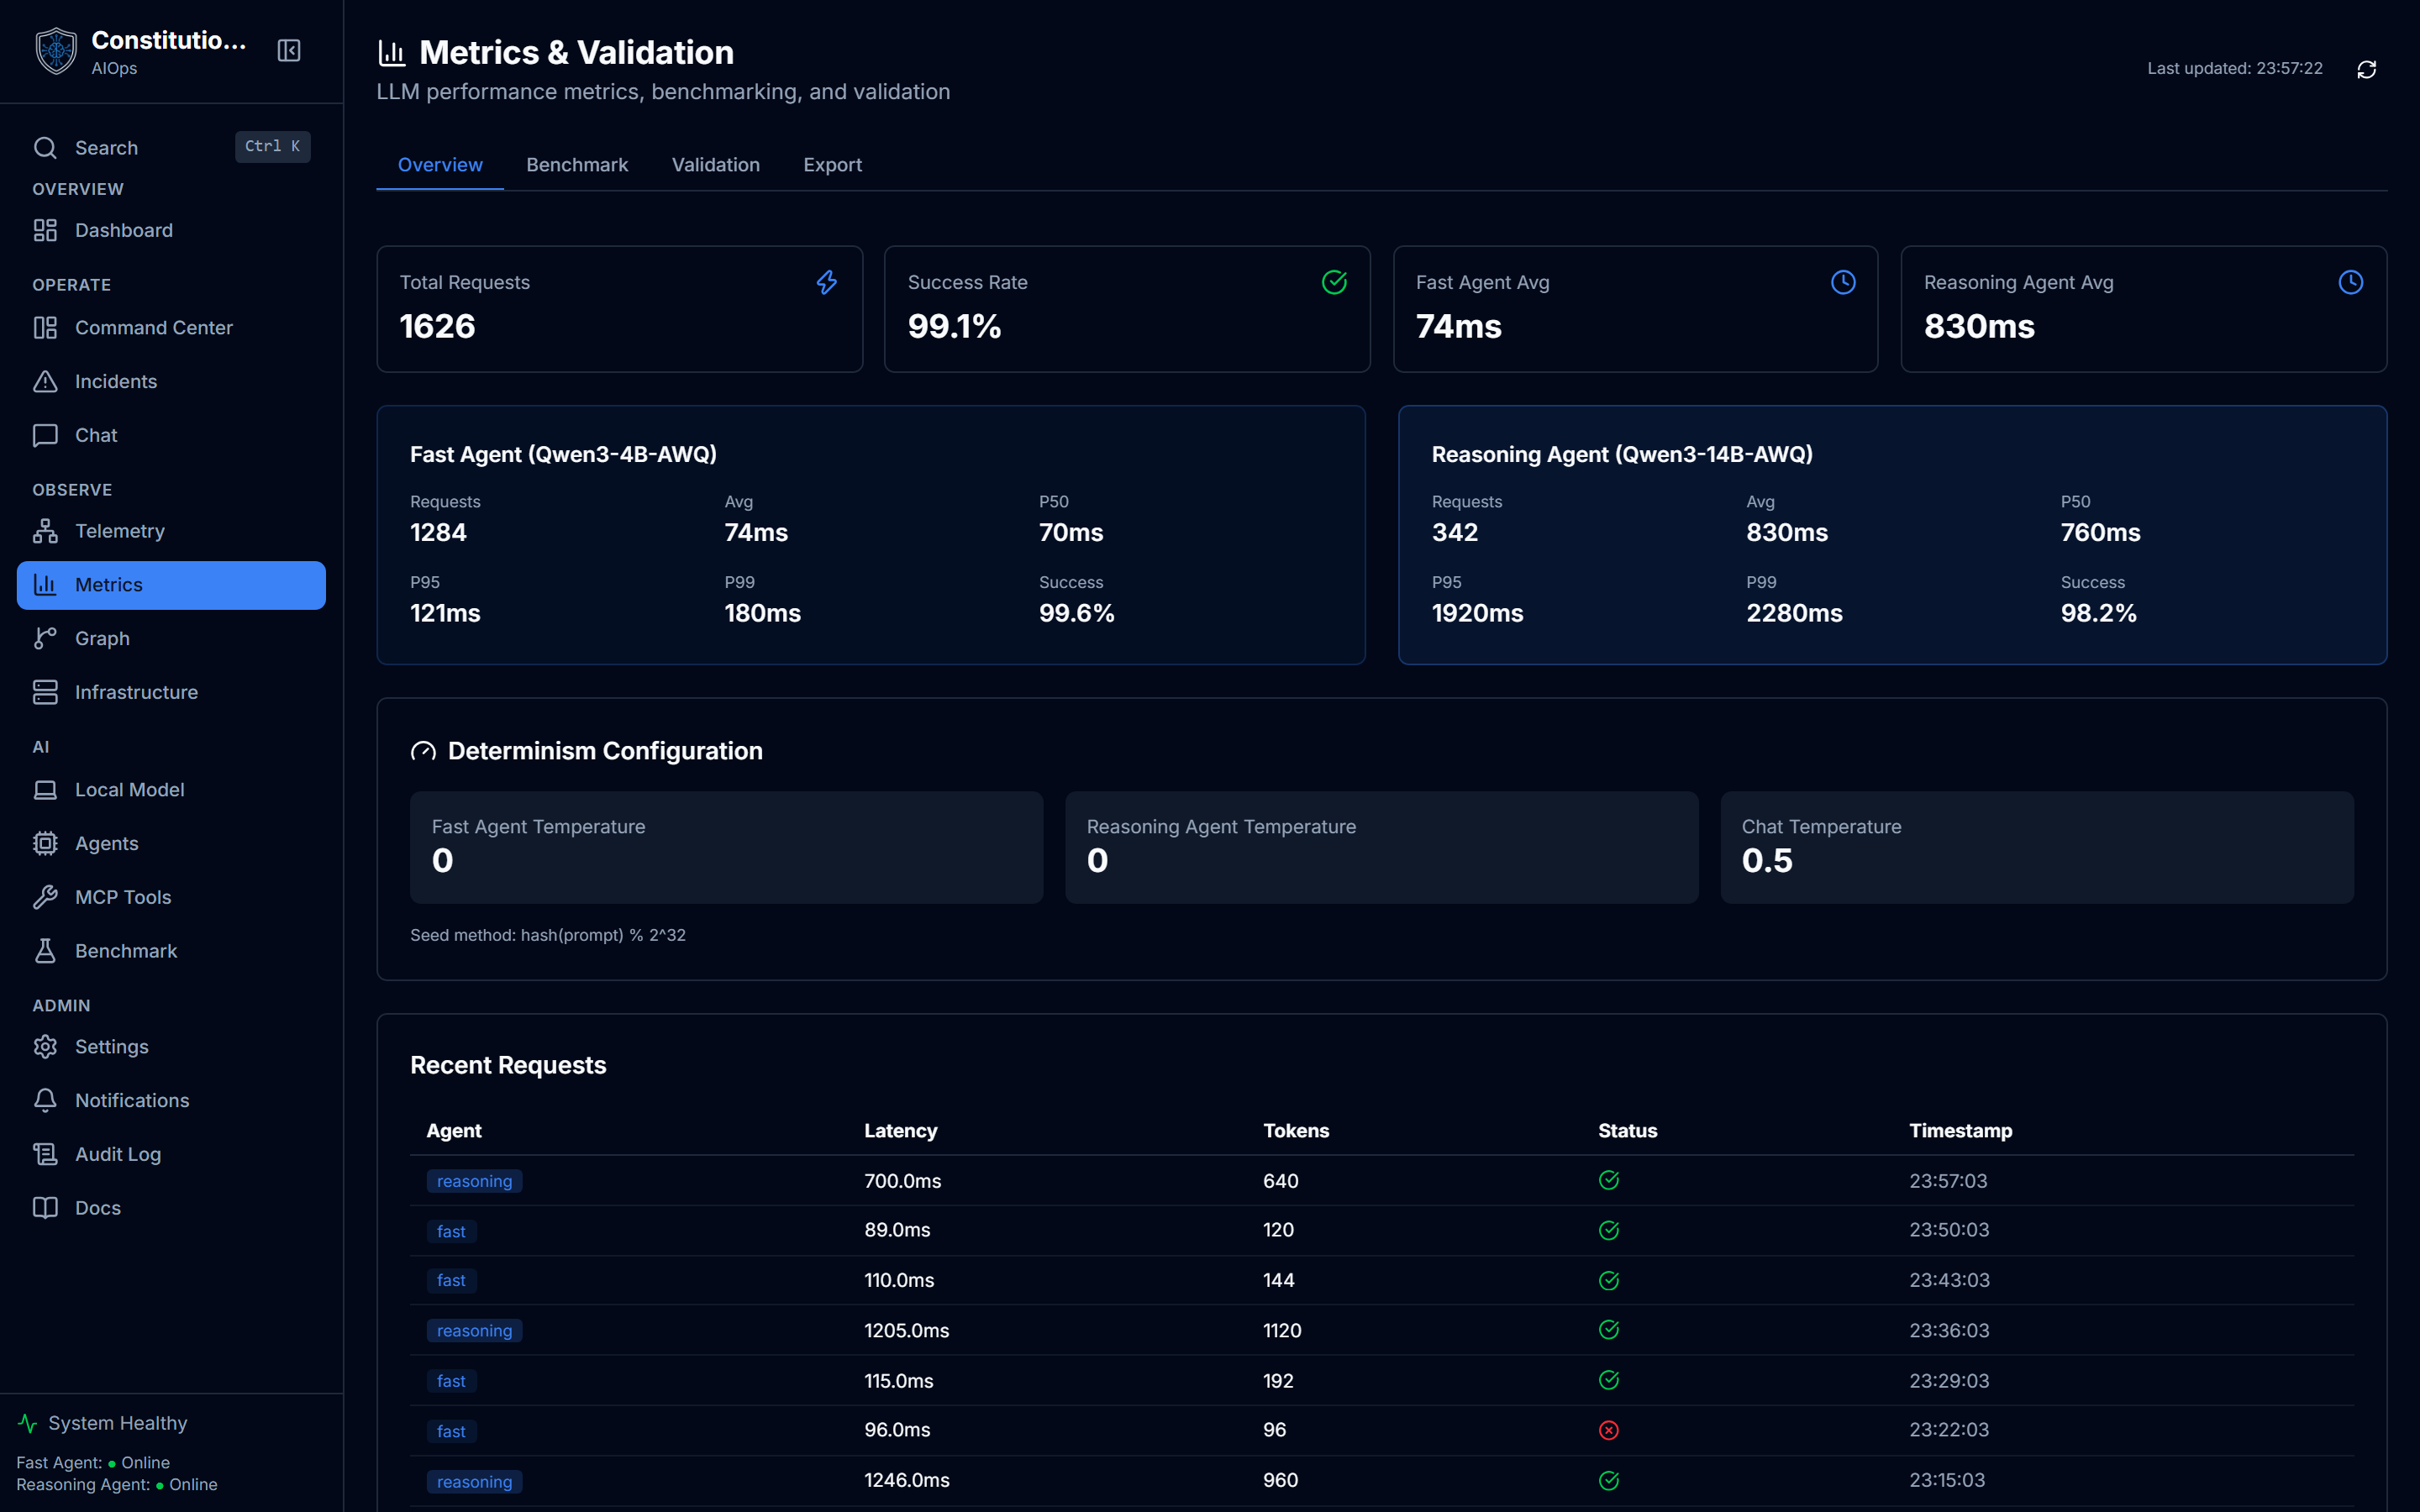
What you see
Four tabs, each backed by /api/v1/metrics:
- Overview. Total requests, overall success rate, and average latency for each agent, plus a full stats card per agent (count, avg, p50, p95, p99, success rate) and a determinism configuration block (fast agent temperature, reasoning agent temperature, chat temperature, seed method). A Recent Requests table lists the last ten calls with agent, latency, tokens, status, and timestamp, from
GET /api/v1/metrics/history. - Benchmark. A control panel to run a latency benchmark against the fast or reasoning agent for a set number of iterations, plus a determinism validation test that repeats the same prompts and checks whether temperature 0 produces identical output.
- Validation. A validation report from
GET /api/v1/metrics/validation/report: system configuration for each agent (model, temperature, purpose), a validation-status grid, and accuracy metrics with explicit disclaimers. - Export. Download the recorded metrics as JSON or CSV, or clear all recorded history.
How to use it
- Open Overview to read current request volume and latency at a glance. The agent labels show the actual configured model name once the validation report loads.
- Switch to Benchmark, pick an agent and an iteration count (1 to 100), and run it. Results show total time, success rate, and full latency statistics (avg, min, max, p50, p95, p99) for that run.
- Run the determinism test to confirm identical prompts produce identical output at temperature 0. Each prompt reports how many unique outputs it produced across the iterations.
- Check Validation for the box's configured models and the current validation status of each metric category.
- Use Export to download JSON or CSV for your own records, or to clear history and start fresh measurements.
Measured, not estimated
Every number under Overview and Benchmark comes from time.perf_counter() around real calls to the configured endpoint, recorded by the model router. The validation report says so directly: latency is "measured client-side via time.perf_counter(). Includes network overhead." Accuracy figures on the Validation tab are a different case: they carry a disclaimer ("Pending validation" until you run a benchmark against labeled data) so they are never mistaken for a live measurement.
Inside the validation report
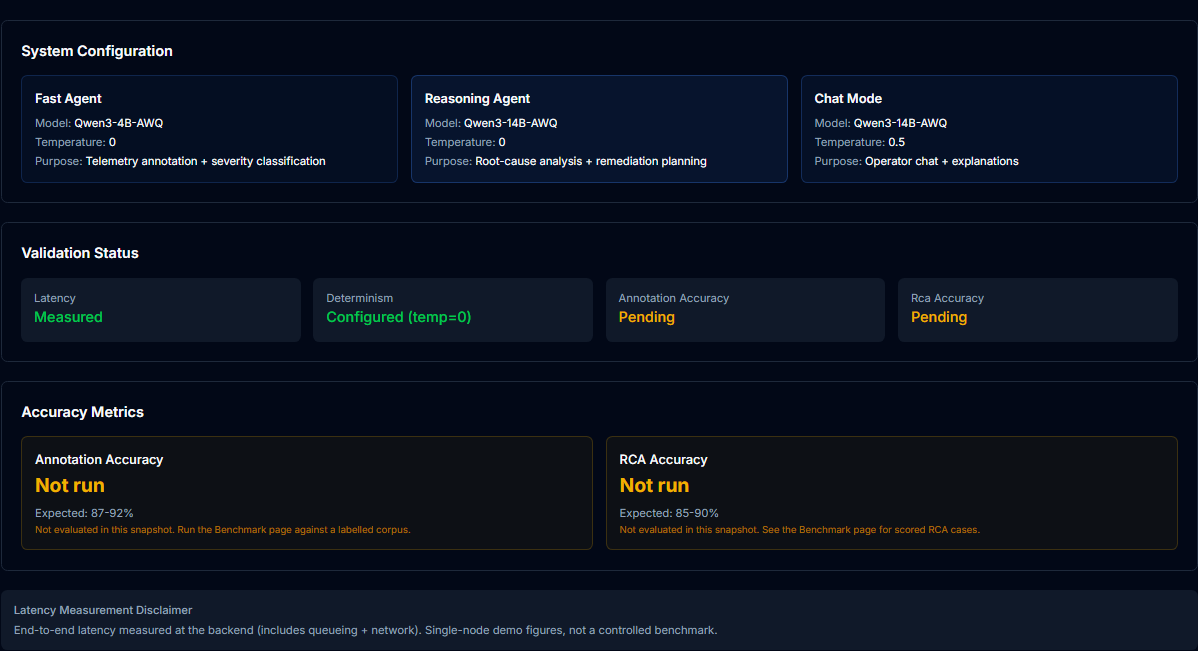
The Validation tab is built to be honest about what is measured and what is not. It has three blocks. System Configuration shows the model, temperature, and purpose for the fast agent, the reasoning agent, and chat mode, read from the box's actual config rather than hardcoded. The validation-status grid marks latency as Measured and determinism as Configured, while annotation and RCA accuracy stay Pending until you score them. Accuracy Metrics then repeats that: each figure reads Not run in this snapshot, next to its expected range and a disclaimer pointing you at the Benchmark page to actually score it. A latency disclaimer at the bottom states plainly that the numbers include queueing and network and are single-node figures, not a controlled benchmark.
Admin-only actions
Running a benchmark or a determinism test spends the box's configured LLM endpoint, so both are admin actions. The backend enforces this with a 403; non-admins still see the recorded stats, the recent-requests table, and the validation report.
Related
- Benchmark runs the same agents against a sample annotation and RCA dataset, with accuracy scoring instead of raw latency.
- Telemetry shows the logs and metrics feeding the rest of the system, with the same honesty about data provenance.
- Settings is where the fast and reasoning agent endpoints get configured in the first place.