Generative UI
Constitutional AIOps has a generative UI layer, but it is built on an honesty rule that is worth stating up front: nothing generated or AI-assisted is ever presented as measured telemetry. Anything a model produced is labelled as such. Anything computed from your real data is computed on your machine and shown as a fact. The two never blur together.
There are two distinct layers, and they behave very differently.
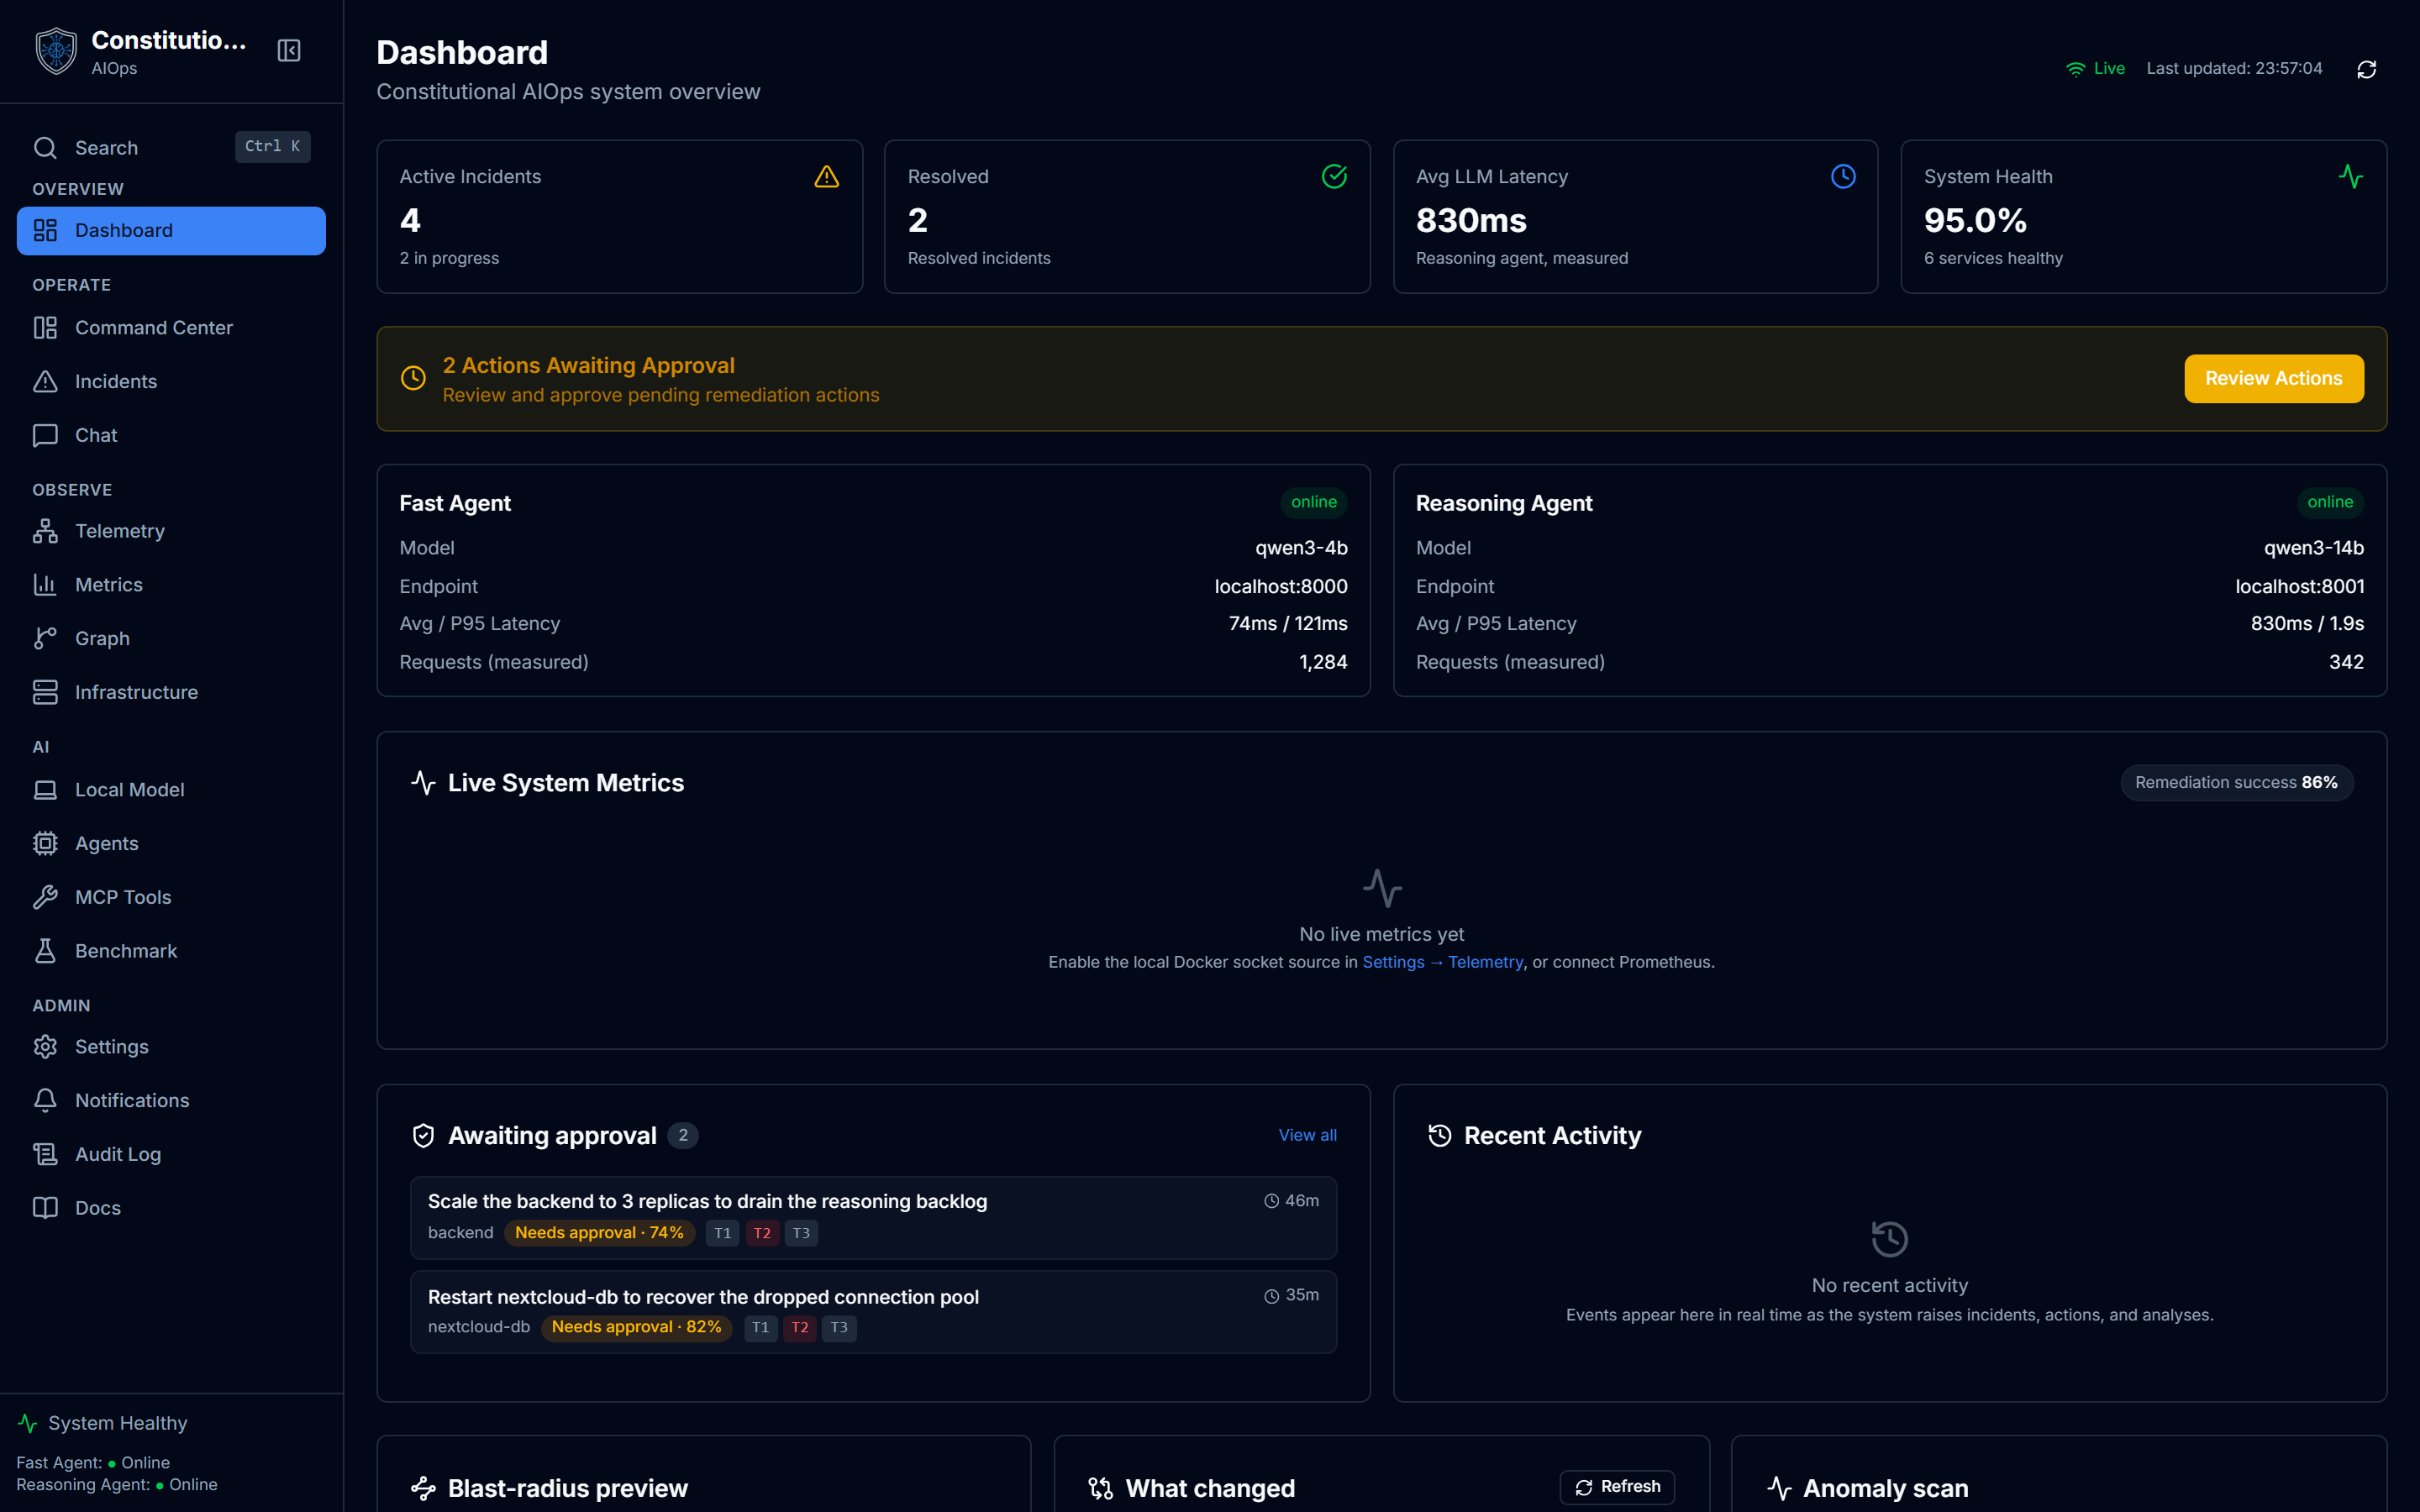
Layer 1: computed widgets (no LLM)
These widgets live on the Dashboard. They are event driven and client computed. They read the same real telemetry the rest of the app uses, derive a view in the browser, and never call a model. That means they work with no LLM endpoint configured at all, they cost nothing per view, and they render instantly.
Each one degrades to an honest empty state when it has no data, rather than showing a plausible-looking placeholder.
- Blast-Radius Preview: for a proposed or active change, the services and dependencies it could touch. Answers "what does this affect" before an action runs.
- What-Changed Diff: a compact diff of what moved between two points in time, so a shift in state is visible without reading raw logs.
- Anomaly Scan: a statistical pass over the current series. It flags points by z-score and direction (unusually high or low). This is arithmetic on your numbers, not a model opinion.
- Capacity forecast: a linear trend fitted to each utilization series, with an estimate of when it would cross a threshold. It is an extrapolation, labelled as such, and only surfaces series that are actually rising toward a limit.
- Metric correlation: the metric series that moved together over the window, ranked by Pearson coefficient. It is explicit that correlation is not causation.
- Live Incident Narrative: a running, plain-language account of an incident assembled from the event stream as events arrive.
- Learned Runbook: the steps that resolved similar incidents before, surfaced from prior activity so a known fix is one glance away.
- Constitutional Approval Ticker: the actions currently waiting on a human decision, drawn straight from the authorization queue.
- Recent Activity: the newest-first log of what the system actually did.
Why "no LLM" matters
These widgets are the reason the app is useful before you connect an endpoint, and the reason they never surprise you with a bill. They are pure functions over real data, unit-tested without a network or a model.
Layer 2: LLM insight widgets (opt-in, cost-fenced)
Some widgets can go one step further and ask a model to explain what they are showing. This is the only place the UI calls an LLM on your behalf from a widget, and it is deliberately fenced:
- It computes first, explains second. The widget derives its full view without a model. The model is only ever asked to explain an already-computed result.
- It is opt-in per user. The "Explain" button appears only if you turned on AI widgets in Settings. A user who never opts in never sees an explain button, and a failed preference fetch degrades to off, so a button is never shown that the app cannot back.
- It never fires on mount. The model is called only when you click "Explain". Nothing is spent just by loading the page.
- The payload is bounded. A widget caps what it sends. The Anomaly Scan, for example, sends only the strongest few flagged points, so a noisy scan cannot drive a huge prompt. The server truncates as well.
- It defaults to the fast tier to keep each explanation cheap.
- It is labelled. An explanation carries an honesty chip that says it is model-generated, not measured telemetry.
Where the "Explain" button appears
Nine widgets carry an opt-in "Explain" button. Each button reads the same computed result the widget already shows, then asks a model to put it in words. The wording is specific to the widget, so you always know what you are asking about. Most explain on the cheap fast tier. Five reads that need deeper reasoning use the reasoning tier: the incident and graph copilots, the live narrative's next-best-action, and the capacity and correlation widgets.
| Widget | Page | Button label | Tier |
|---|---|---|---|
| Anomaly scan | Dashboard | Explain these anomalies | Fast |
| Blast-Radius Preview | Dashboard | Explain the blast radius | Fast |
| What-Changed Diff | Dashboard | Explain what changed | Fast |
| Learned Runbook | Dashboard | Explain this runbook | Fast |
| Live Incident Narrative | Dashboard | Suggest next best action | Reasoning |
| Incident Copilot | Incidents detail | Explain this incident | Reasoning |
| Graph Copilot | Graph Explorer | Explain this graph | Reasoning |
| Capacity forecast | Dashboard | Explain this forecast | Reasoning |
| Metric correlation | Dashboard | Explain these correlations | Reasoning |
A button shows only when two things are true at once: you have AI widgets turned on, and the widget actually has data to explain. An empty widget offers no button, so a call is never spent on nothing.
How to turn it on
- Open Settings and find the AI insight widgets card.
- Turn on AI widgets. This writes a per-user preference, so your choice does not change anything for anyone else.
- Open a supported widget from the table above and use its Explain button.
There is nothing to install and no key to paste here. The button uses whatever LLM endpoint the app is already pointed at. Explanations always happen on a click. Nothing explains itself on load.
The button, state by state
Every Explain button moves through the same states. The Anomaly scan widget is the worked example below, and the other six behave identically with their own wording.
- Idle. A small outlined button with a sparkle icon and the widget's label, for example
Explain these anomalies. Nothing has been sent yet. - Working. On click the sparkle becomes a spinner and the label switches to
Explaining…. Some reasoning-tier widgets readThinking…,Reading the incident…orReading the graph…instead. The button is disabled while it runs, so a second click cannot fire a second call. - Explained. The button is replaced in place by an explanation panel. The panel always carries the same honesty header: a sparkle icon with the words AI explanation, the model's text, and a caption that reads Model-generated hypothesis, not measured telemetry. The computed widget above it is untouched.
- Note. If the call cannot produce an explanation, the button stays and a short line appears under it saying why and what to do next. The exact lines are in the table further down.
What each explanation is allowed to send
An explanation never ships your raw telemetry to a model. It sends only the small computed summary the widget already shows, capped so a noisy view cannot build a large prompt. The server truncates again on its own side.
- Anomaly scan: the strongest 5 flagged points plus the total count.
- Blast-Radius Preview: up to 12 services per hop, with empty hops dropped.
- Live Incident Narrative: up to 3 incidents, 12 stages each.
- Learned Runbook: the strongest 6 rows.
- Capacity forecast: the full series count plus the 5 series closest to a threshold, each with its current value, threshold and estimated time to breach.
- Metric correlation: the strongest 6 correlated pairs, each with its rounded coefficient.
- Graph Copilot: the top 6 root causes, actions and services, plus 5 incidents worth attention.
- Incident Copilot: up to 8 services, causal-chain steps and remediation steps, with any long description trimmed.
When it cannot explain
The insight layer never breaks the computed widget under it. When a call cannot return an explanation the widget keeps its rule-based view and shows one honest line:
| Situation | Line shown |
|---|---|
| AI widgets are off | Turn on AI insight widgets in Settings to explain this. |
| No LLM endpoint set | Add an LLM endpoint in Settings to enable explanations. |
| Daily budget reached | Daily AI budget reached. Explanations resume tomorrow. |
| Model returned nothing | The model returned no explanation. Try again. |
| Endpoint unreachable | Could not reach the LLM endpoint just now. |
| Anything else | Explanation is unavailable right now. |
In every one of these cases the computed widget is still there and still correct. The LLM layer is additive, never load-bearing.
In-browser local chat (WebLLM)
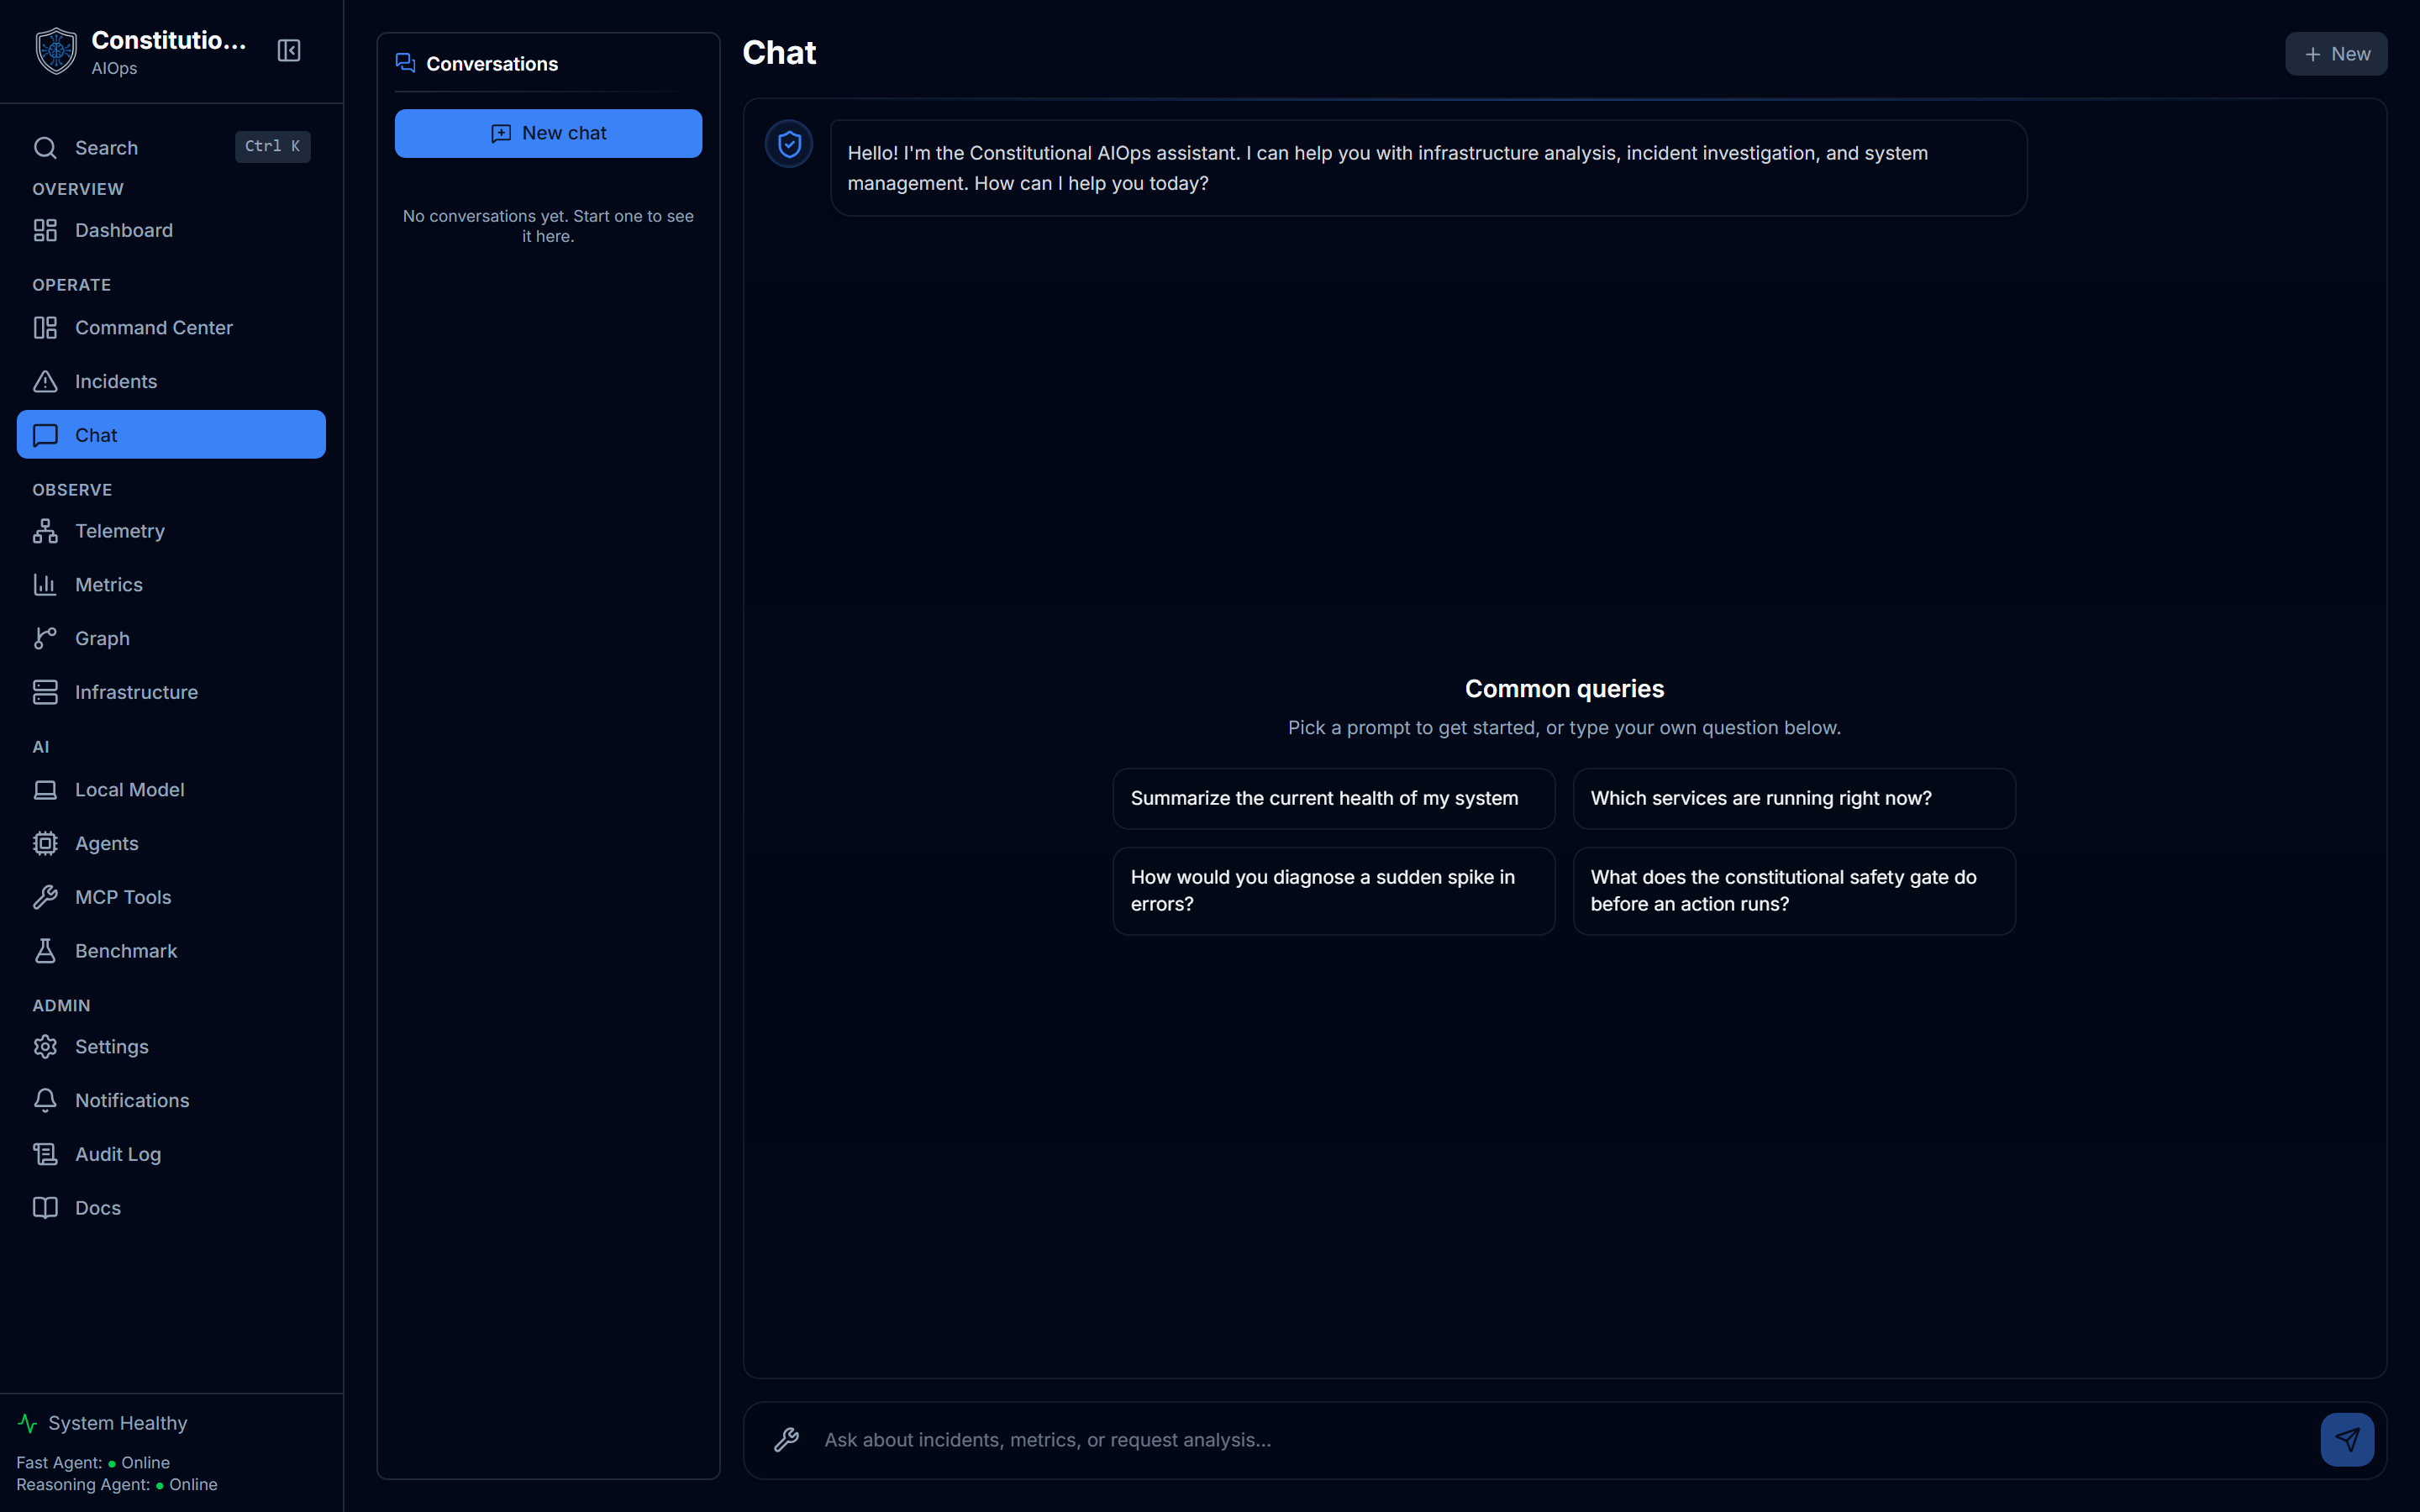
For a fully client-side option, the app can run a small model entirely in your browser through WebLLM.
- It loads through a dynamic import, so the large WASM and engine payload never enters the main bundle and is fetched only the first time you load a local model.
- Inference runs on your own device via WebGPU. Model weights download to your browser cache.
- Nothing is sent to our servers. This is the most private way to try the assistant, at the cost of running a deliberately small model.
Open it from the local-chat route, or from the Chat page's local option. The curated model list is intentionally tiny, ordered smallest and fastest first, because large models are impractical in a browser tab.
Command palette
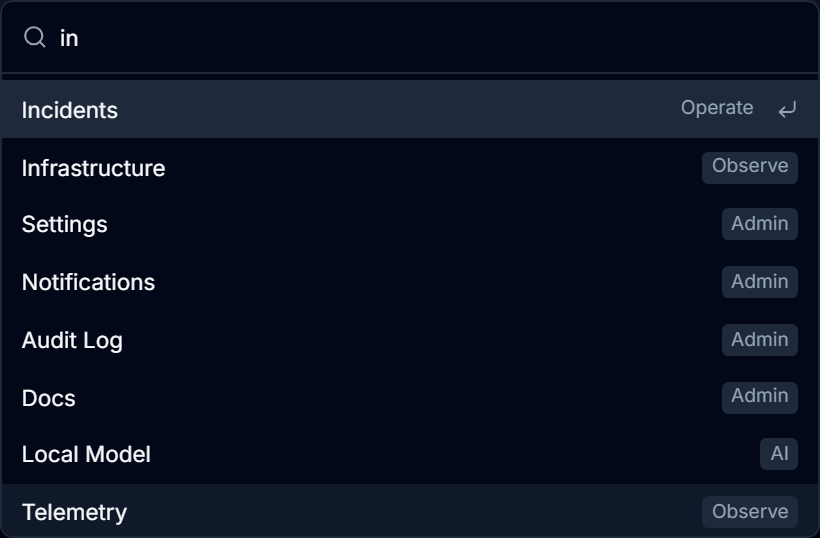
Press Cmd/Ctrl + K anywhere to open the command palette. It is a zero-dependency fuzzy quick-nav over the app's own routes: type a few characters, get a ranked list, press Enter to go. An exact title match beats a prefix, which beats a substring, which beats a scattered subsequence. An empty query lists every command in order, so it doubles as a "browse all" view.
The honesty contract, in one place
| Element | Source | How it is labelled |
|---|---|---|
| Computed widgets | Your real telemetry, in-browser | Shown as fact |
| Anomaly z-scores | Arithmetic on your series | Shown as fact |
| "Explain" output | An LLM, on click, opt-in | Marked model-generated |
| Local chat | A model in your browser | Runs on your device, nothing sent to us |
If you remember one thing: the generative and AI-assisted views are labelled, opt-in, and never dressed up as measurements.