Dashboard
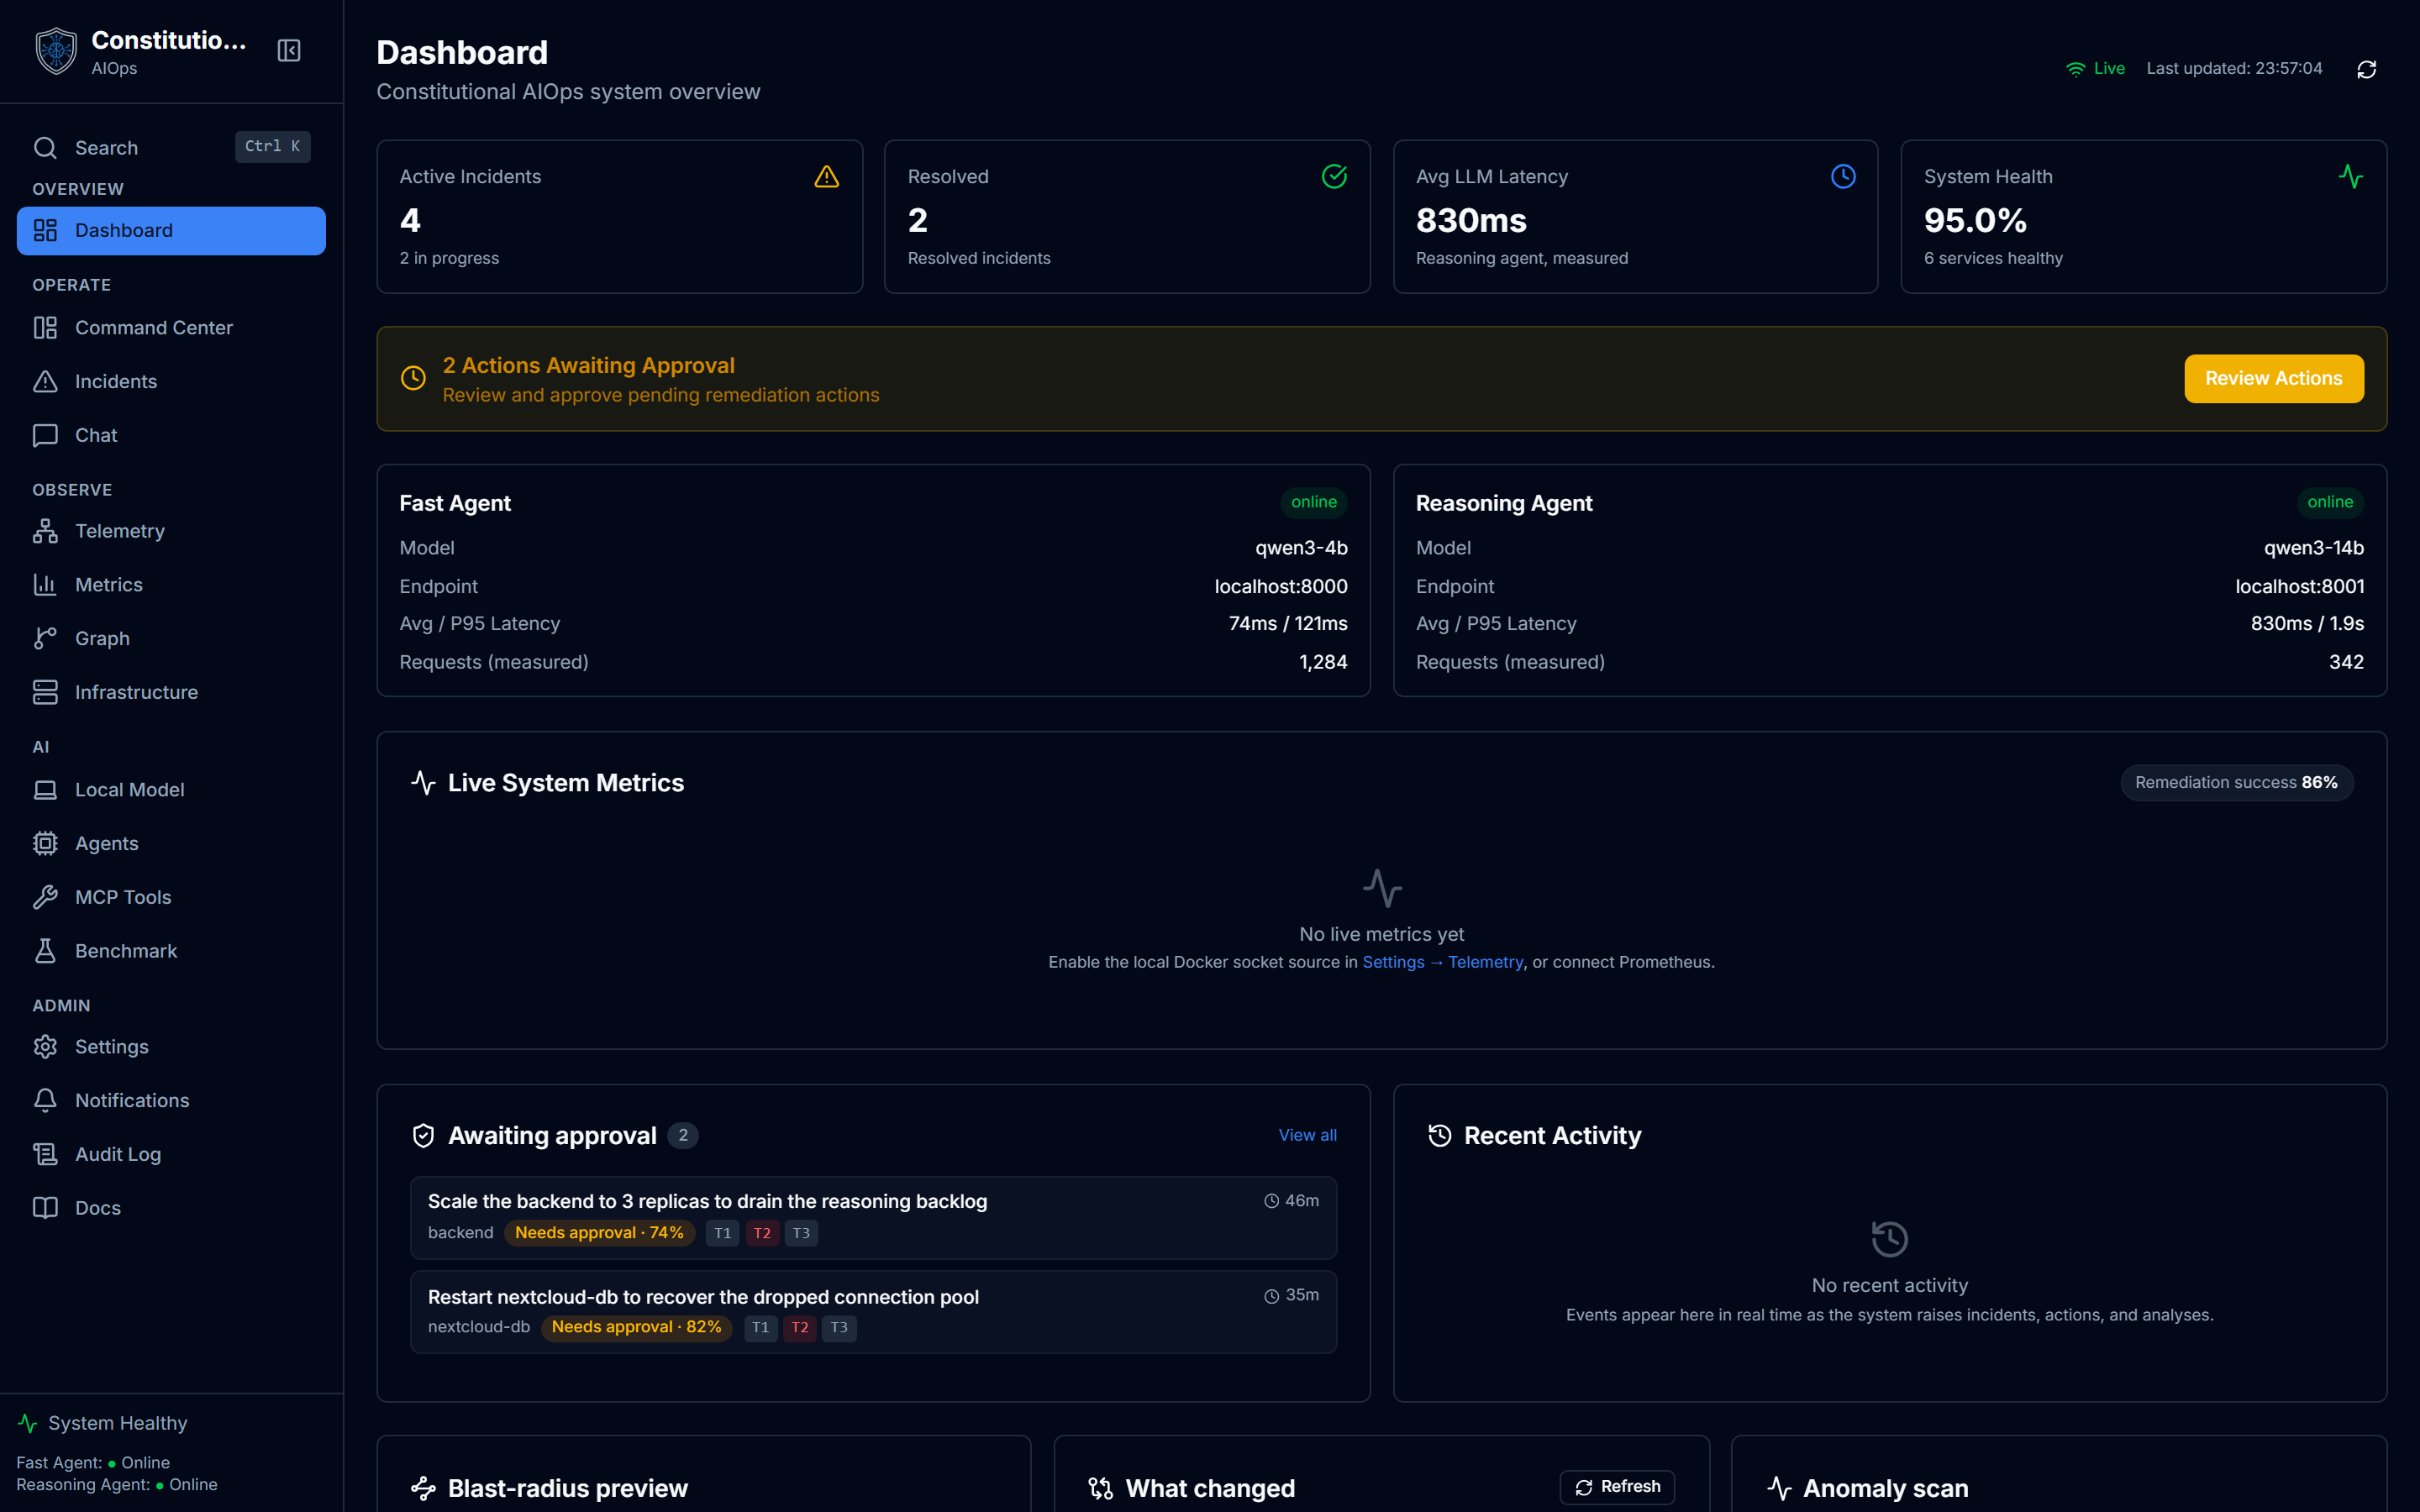
The Dashboard is the live system view. It is the first screen after sign-in and it refreshes from real telemetry over a WebSocket, so what you see is current without a manual reload.
What you see
- Service status across the monitored components, each marked healthy, unhealthy, or unknown, with a badge that tells you which services are actually being watched.
- Agent latency, measured. The fast and reasoning agent cards show real request counts and p95 latency from
GET /api/v1/metrics, not placeholder numbers. Latency renders in ms or s depending on magnitude. - Configured endpoints, shown as host or host:port. A remote endpoint such as Bedrock has no local port, so the card shows the host honestly rather than inventing one.
- A live connection indicator. When the WebSocket is connected the view updates as events arrive. When it drops you see the disconnected state instead of stale data pretending to be live.
- The event-driven and insight widgets: Approval Ticker, Blast-Radius Preview, What-Changed Diff, Anomaly Scan, Capacity forecast, Metric correlation, Live Incident Narrative, Learned Runbook, and Recent Activity. These are covered in depth in Generative UI.
Measured agent latency

The agent cards read from real request metrics, not placeholders. Each shows the model, the configured endpoint as host or host:port, the average and p95 latency, and the measured request count. A remote endpoint with no local port, such as Bedrock, shows the host honestly rather than inventing a port.
Live per-service metrics
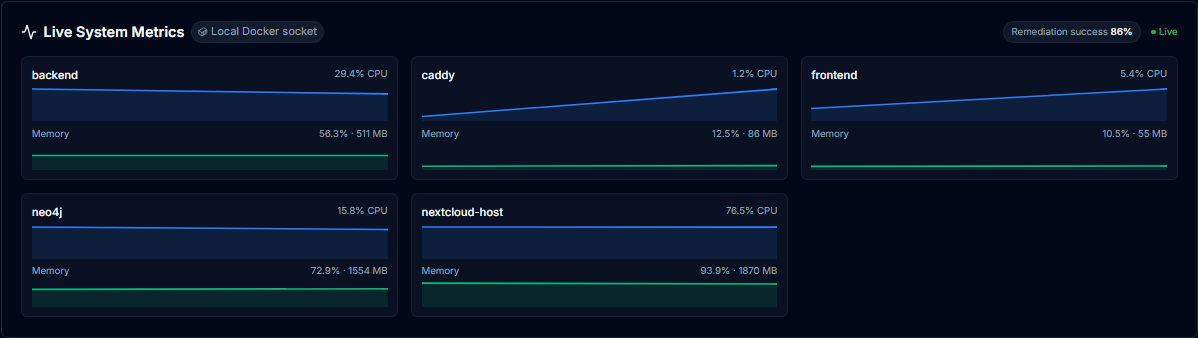
On the lite tier the Live System Metrics panel reads CPU and memory per service straight from the Docker socket and keeps a rolling client-side window, so each card shows a real trend rather than a single frozen number. A service that stops reporting simply stops growing its line, and when no source is present the panel says so instead of drawing a fabricated one.
First-run tour and What's new
The first time a browser signs in, a short guided tour introduces the main screens, one step at a time, and ends by pointing at Settings. It is a plain modal walkthrough rather than fragile spotlight overlays, so it behaves the same whether the sidebar is expanded, collapsed to icons, or a drawer on mobile. You can skip it at any step, and replay it any time from the command palette (Cmd/Ctrl + K, "Take the product tour").
A returning browser that has already seen the tour instead gets a small, dismissible "What's new" banner listing what changed since the app version it last saw. Both are remembered per browser and fail soft, so a cleared cache simply shows the tour again, and neither ever opens under browser automation.
How to use it
- Read the top row first. Service status and the connection indicator tell you whether the picture is complete and current. If the socket is disconnected, reconnect before trusting the widgets.
- Check agent latency to confirm your endpoints are responsive. A rising p95 on the reasoning agent is usually the first sign of a slow endpoint.
- Scan the widgets for anything flagged. The Anomaly Scan and What-Changed Diff surface change before it becomes an incident.
- Follow the Approval Ticker for actions waiting on a human. Each entry links through to the action that needs a decision.
- Use Recent Activity as the audit trail of what the system just did, newest first.
When something is missing
The Dashboard degrades honestly. Without a live WebSocket it shows the disconnected state. Without measured metrics yet, latency cards show a dash rather than a fabricated figure. The computed widgets each fall back to a clear empty state when they have no data to work from.