Graph Explorer
The Graph Explorer visualizes the episodic knowledge graph: how incidents, their root causes, the actions taken, the services involved, and the entities the model extracted all connect to each other.
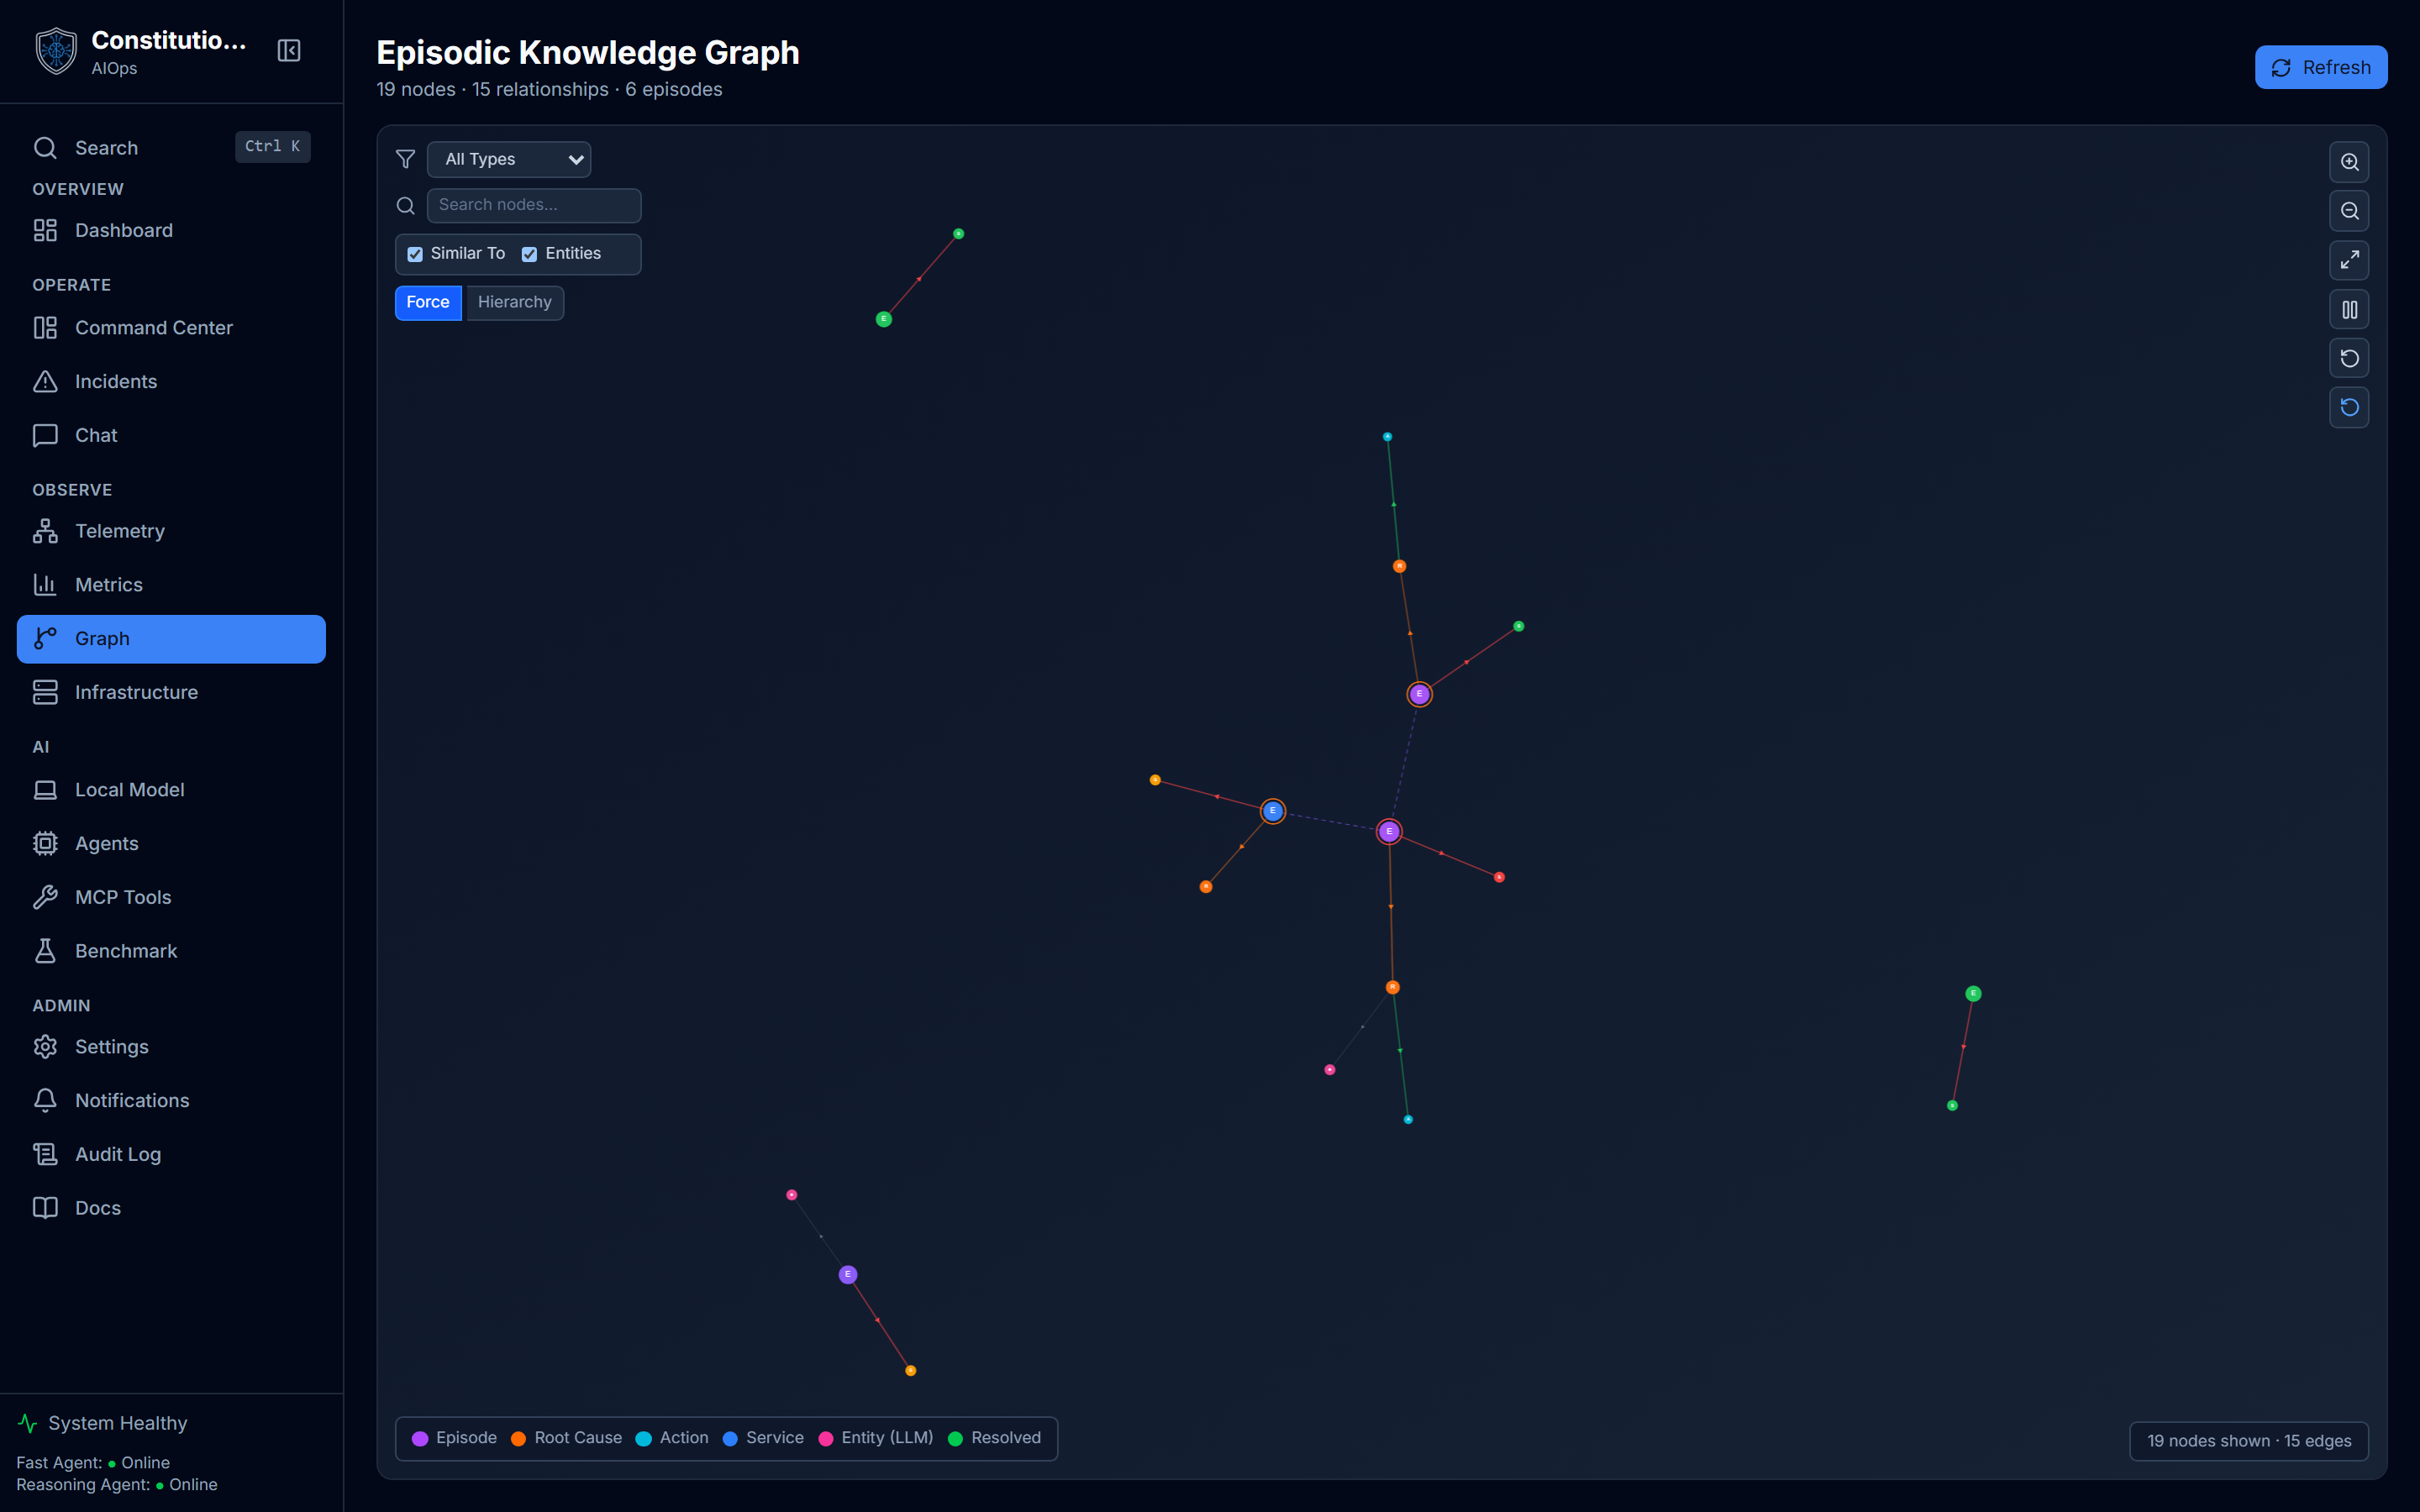
What you see
Nodes are typed and colored by what they are:
- Episodes and incidents: a thing that happened.
- Root causes: what the analysis concluded was behind it.
- Actions: what was done in response.
- Services: the components involved.
- Entities: items the LLM extracted from the incident context.
Nodes also carry a status such as healthy, warning, critical, detected, analyzing, remediating, or resolved, so the graph shows not just structure but current state.
How to use it
- Start from an incident node and follow its edges to the root cause and the actions that addressed it.
- Use the edge filtering controls to hide relationship types you do not care about, so a dense graph stays readable.
- Switch on DAG mode to lay the graph out top-down when you want a clear hierarchy rather than a force-directed cloud.
- Trace a service to see every episode it was part of, which is how a recurring cause becomes obvious.
Ask the graph copilot

The "Explain this graph" copilot gives a reasoning-tier read of what the incident memory suggests: the dominant failure themes, which remediations actually worked, and where to focus next. It summarizes the graph you are looking at and is labeled as a model-generated hypothesis, not measured telemetry, so you treat it as a starting point rather than a fact.
Graph memory backends
The episodic graph has a pluggable backend, set by AIOPS_GRAPH_BACKEND:
neo4j(the default, and the full GPU stack): the full graph database, the richest queries and the highest fidelity.embedded(the lite tier default): a persistent store in a local SQLite file, with no Neo4j server to run. Incident memory survives restarts and the graph fills up as the app runs.memory: an ephemeral in-process store for tests, empty again after a restart.
Whichever backend is active, the rest of the product uses the same in-process episode working set and similarity search. Neo4j gives the fullest graph queries; the embedded store is the lightweight, no-server path that still persists. See Configuration for the details.