MCP tools
The MCP Tools page is the platform's tool surface, exposed directly: the same tools the agents call, listed with their parameters so you can run one yourself and see exactly what it returns.
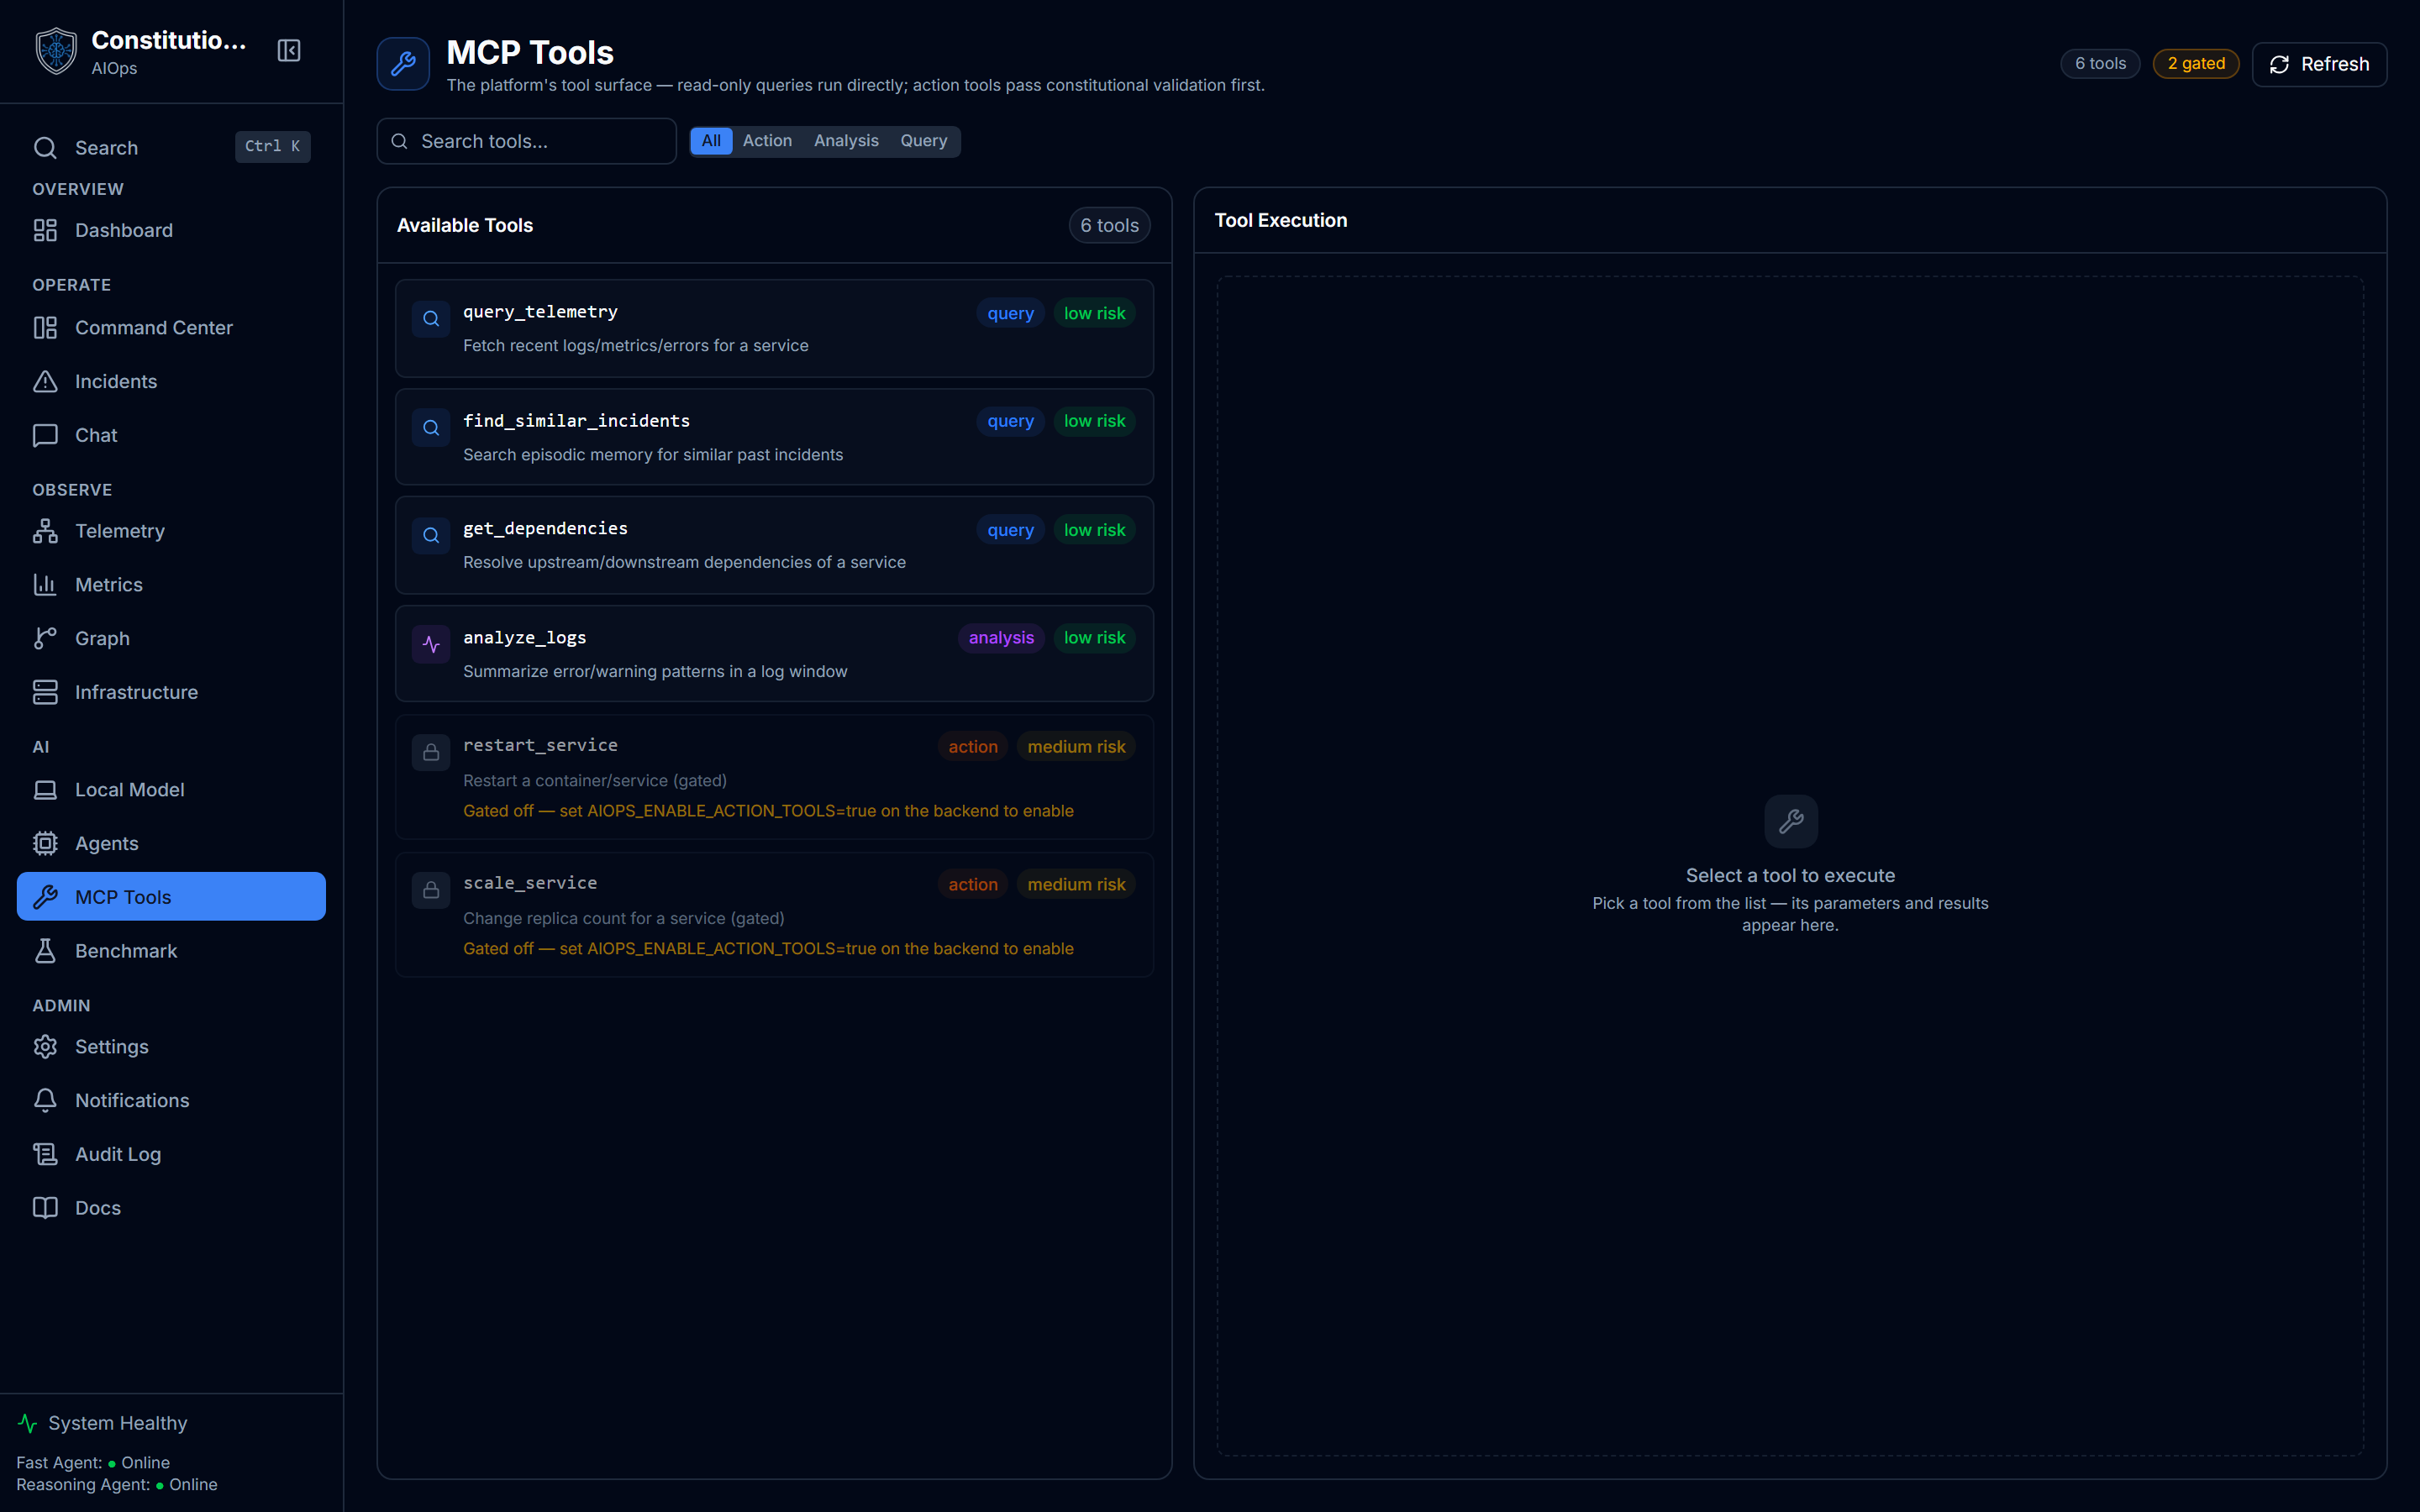
What you see
- A tool list fetched from
GET /api/v1/tools/, each card showing the tool's name, category (query, analysis, or action), a risk-level badge (low, medium, high), and a one-line description. - Search and category filters above the list, plus a running count of how many tools are gated off.
- An execute panel on the right: pick a tool and its parameter form appears, built from the tool's JSON-Schema parameters.
- A result view after running a tool, showing success/failure, the response data, and timing.
- An execution history for the current session (not persisted) of the last 20 calls, each marked ok, approval, or error.
How to use it
- Browse or search the tool list. Filter by category if you only want to see, say, action tools.
- Select a tool to load its parameter form on the right.
- Fill in parameters and click Execute Tool. Read-only tools run immediately.
- Confirm an action tool. Clicking Execute on
restart_serviceorscale_serviceshows a confirmation step describing exactly what will run, with a warning that it is a real Docker operation. Confirming submits the call; it is only actually executed if the constitutional validator authorizes it. - Read the result. For an action tool, the result carries the constitutional verdict alongside the data, whether the call succeeded, was blocked, or needs human approval.
- Check the history strip to see what you have run this session.
What a run looks like
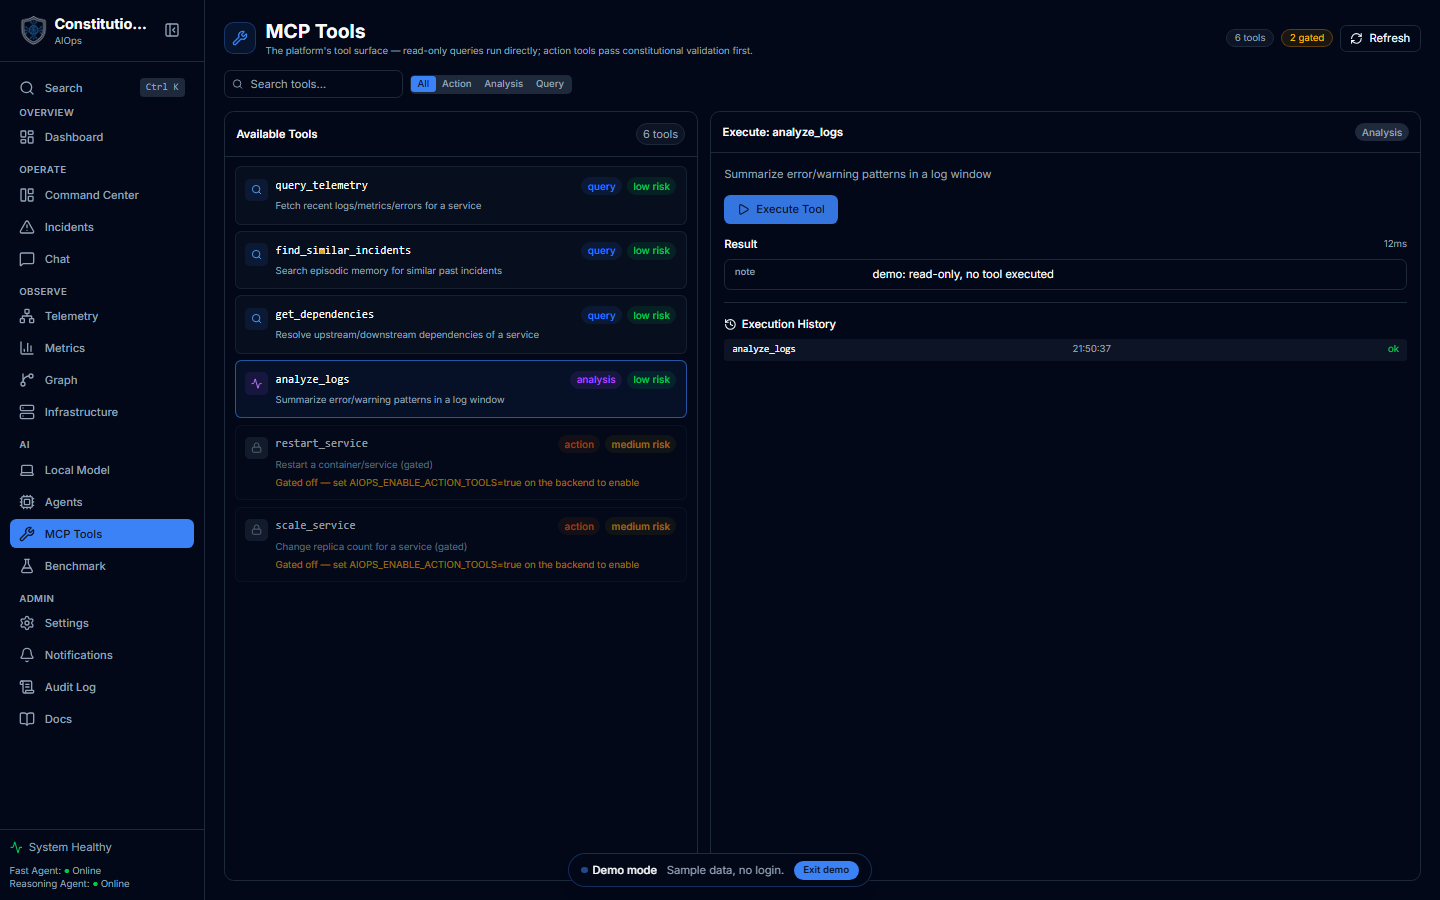
Selecting a read-only tool loads it into the execute panel on the right. analyze_logs runs the moment you click Execute, and the result comes back with its timing and lands in the execution-history strip marked ok. In the list on the left, restart_service and scale_service are locked with a lock icon and a "Gated off" note, since AIOPS_ENABLE_ACTION_TOOLS is not set here. The header counts them too, next to a gated badge. That is the kill-switch layer of the gate, visible before you even open a tool.
The demo exposes six tools here, four read/analysis plus the two gated action tools. A full backend ships the eight described next, with the same two action tools gated off until you enable them.
The built-in tools
Eight tools ship by default. Six are read/analysis tools with no gating: find_similar (Neo4j episodic memory), get_dependencies (Neo4j dependency graph), analyze_logs and query_recent_logs (Loki), query_metric (Prometheus), analyze_time_series_anomaly (Z-score analysis on metrics), and list_containers (Docker). Two are action tools: restart_service and scale_service, both risk_level: medium and requires_approval: true.
The constitutional gate over action tools
Action tools never run unguarded. Every call to restart_service or scale_service goes through a layered gate before anything touches Docker:
- The kill switch. Action tools are refused outright unless
AIOPS_ENABLE_ACTION_TOOLSis set on the backend. Until then, the tool list marks themenabled: falsewithgated_bynaming the env var, the card in the list shows a lock icon, and the execute panel explains why. - Validator availability. If the constitutional validator itself is not wired up, the call is refused rather than executed unvalidated.
- A container whitelist. The target service must resolve to a whitelisted container name (
nextcloudby default, extendable viaAIOPS_ACTION_CONTAINER_WHITELIST) before the validator even runs. - The validator's verdict. A blocked verdict refuses the call (
validation_blocked); a verdict that needs a human refuses it too (approval_required) rather than executing (the REST path here does not wire up the separate human-approval-then-run flow). Only an automatic, passing verdict executes.
The serialized verdict (can it proceed, does it need approval, which tier principles passed, any violations or warnings) is attached to the result whenever validation ran, on both refusals and successes, so you can see exactly why a call went the way it did.
Constitutionally gated, not just permission-gated
A tool being "enabled" only removes the kill-switch layer. Every individual call still goes through the validator, the whitelist check, and (for a non-container target) a mandatory human-approval step. Nothing here is a raw, ungated Docker operation.
Plugin tools
Third-party packages can contribute additional tools through a Python entry point group (constitutional_aiops.tools), but this is off by default: nothing loads unless AIOPS_ENABLE_PLUGINS is set on the backend. With it unset, the plugin surface effectively does not exist. When enabled, a plugin tool is registered into the exact same catalogue, listing, and dispatch tables the built-in tools use. A plugin action tool has no separate path to execution: it is routed through the identical gate described above, and a non-container plugin action always requires human approval regardless of the validator's confidence. A plugin cannot shadow a built-in tool name, and a malformed or misbehaving plugin is logged and skipped rather than breaking the tool surface.
Related
- Infrastructure is where you monitor the containers these tools query and act on.
- Guide: Safety explains the constitutional principles and authorization tiers the validator applies.
- Console and Chat are where the agents call these same tools during a conversation.